Live Activity Monitoring
This article describes how to configure and use runtime monitoring services in NGINX Plus: the interactive Dashboard and NGINX Plus REST API.
NGINX Plus provides various monitoring tools for your server infrastructure:
-
the interactive Dashboard page available since NGINX Plus Release 9 - a real-time live activity monitoring interface that shows key load and performance metrics of your server infrastructure.
-
NGINX REST API available since NGINX Plus Release 14 - an interface that can obtain extended status information, reset statistics, manage upstream servers on-the-fly, and manage key-value store. With the API you can connect NGINX Plus status information with third-party tools that support the JSON interface, for example, NewRelic or your own dashboard.
Note: Prior to NGINX Plus R14, gathering statistics and management of upstream servers in the Dashboard was performed with the status and upstream_conf modules. Now the extended status and upstream_conf modules are superseded by the api module. Starting from R16, the status and upstream_conf modules will be removed and completely superseded with the api module.
- NGINX Plus R14 and later for NGINX Plus REST API and the Dashboard
- Data for statistics (see Gathering Data to Appear in Statistics)
In order to collect data from virtual servers, upstream server groups, or cache zones, you will need to enable shared memory zones for the objects you want to collect data for. A shared memory zone stores configuration and runtime state information referenced by NGINX worker processes.
-
To make HTTP and TCP server to appear in statistics, specify the
status_zonedirective. The same zone name can be specified more than once for manyserverblocks. Since R19, the status_zone directive can also be specified forlocationblocks - in this case, the statistics will be aggregated separately for servers and locations in the Dashboard:nginx server { # ... status_zone status_page; location / { proxy_pass http://backend; status_zone location_zone; } } -
To make an upstream server group to appear in statistics, specify the
zonedirective per eachupstreamblock:nginx upstream backend { zone backend 64k; server backend1.example.com; server backend2.example.com; } -
To make cache appear in statistics, make sure that caching is enabled in your configuration. A shared memory zone for caching is specified in the
proxy_cache_path,fastcgi_cache_path,scgi_cache_path, oruwsgi_cache_pathdirective in thekeys_zoneparameter. See NGINX Content Caching for more information:nginx http { # ... proxy_cache_path /data/nginx/cache keys_zone=one:10m; } -
To make health checks appear in statistics, make sure that health checks are enabled with the
health_checkdirective and the server group resides in the shared memory. See HTTP Health Checks and TCP Health Checks for more information.nginx server { # ... status_zone status_page; location / { proxy_pass http://backend; health_check; } } -
To make cluster information appear in the Dashboard, make sure that F5 NGINX Plus instances are organized in the cluster and zone synchronization is enabled on each instance. See Runtime State Sharing in a Cluster for details.
-
To make resolver statistics appear in the Dashboard, specify the
status_zoneparameter of theresolverdirective:nginx resolver 192.168.33.70 status_zone=resolver-zone1; server { # ... } -
When finished, save and exit configuration file.
-
Test the configuration and reload NGINX Plus:
sudo nginx -t && sudo nginx -s reload
To enable the API:
-
In the
httpcontext, specify aserverblock that will be responsible for the API:nginx http { server { # your api configuration will be here } } -
Create a
locationfor API requests and specify theapidirective in this location:nginx http { # ... server { listen 192.168.1.23; # ... location /api { api; # ... } } } -
In order to make changes with the API, such as resetting statistics counters, managing upstream servers on-the-fly or key-value storage, managing upstream servers from the Dashboard, enable the read-write mode for the API by specifying the
write=onparameter for theapidirective:nginx http { # ... server { listen 192.168.1.23; # ... location /api { api write=on; # ... } } } -
It is recommended restricting access to the API location, for example, allow access only from local networks with
allowanddenydirectives:nginx http { # ... server { listen 192.168.1.23; # ... location /api { api write=on; allow 192.168.1.0/24; deny all; } } } -
It is also recommended restricting access to
PATCH,POST, andDELETEmethods to particular users. This can be done by implementingHTTP basic authentication:nginx http { # ... server { listen 192.168.1.23; # ... location /api { limit_except GET { auth_basic "NGINX Plus API"; auth_basic_user_file /path/to/passwd/file; } api write=on; allow 192.168.1.0/24; deny all; } } } -
Enable the Dashboard by specifying the
/dashboard.htmllocation. By default the Dashboard is located in the root directory (for example,/usr/share/nginx/html) specified by therootdirective:nginx http { # ... server { listen 192.168.1.23; # ... location /api { limit_except GET { auth_basic "NGINX Plus API"; auth_basic_user_file /path/to/passwd/file; } api write=on; allow 192.168.1.0/24; deny all; } location = /dashboard.html { root /usr/share/nginx/html; } } } -
As an option you can try the Swagger UI - an interactive documentation tool for the API specification supplied in a OpenAPI YAML file and used with NGINX Plus. Download the Swagger UI and the OpenAPI YAML specification, specify a
locationfor them, for example, /swagger-ui, the path to its files with therootdirective, for example, /usr/share/nginx/html and limit access to local networks withallowanddenydirectives. See The Swagger UI section for details.nginx http { # ... server { listen 192.168.1.23; # ... location /api { limit_except GET { auth_basic "NGINX Plus API"; auth_basic_user_file /path/to/passwd/file; } api write=on; allow 192.168.1.0/24; deny all; } location = /dashboard.html { root /usr/share/nginx/html; } location /swagger-ui { add_header Content-Security-Policy "default-src 'self'"; root /usr/share/nginx/html; allow 192.168.1.0/24; deny all; } } }
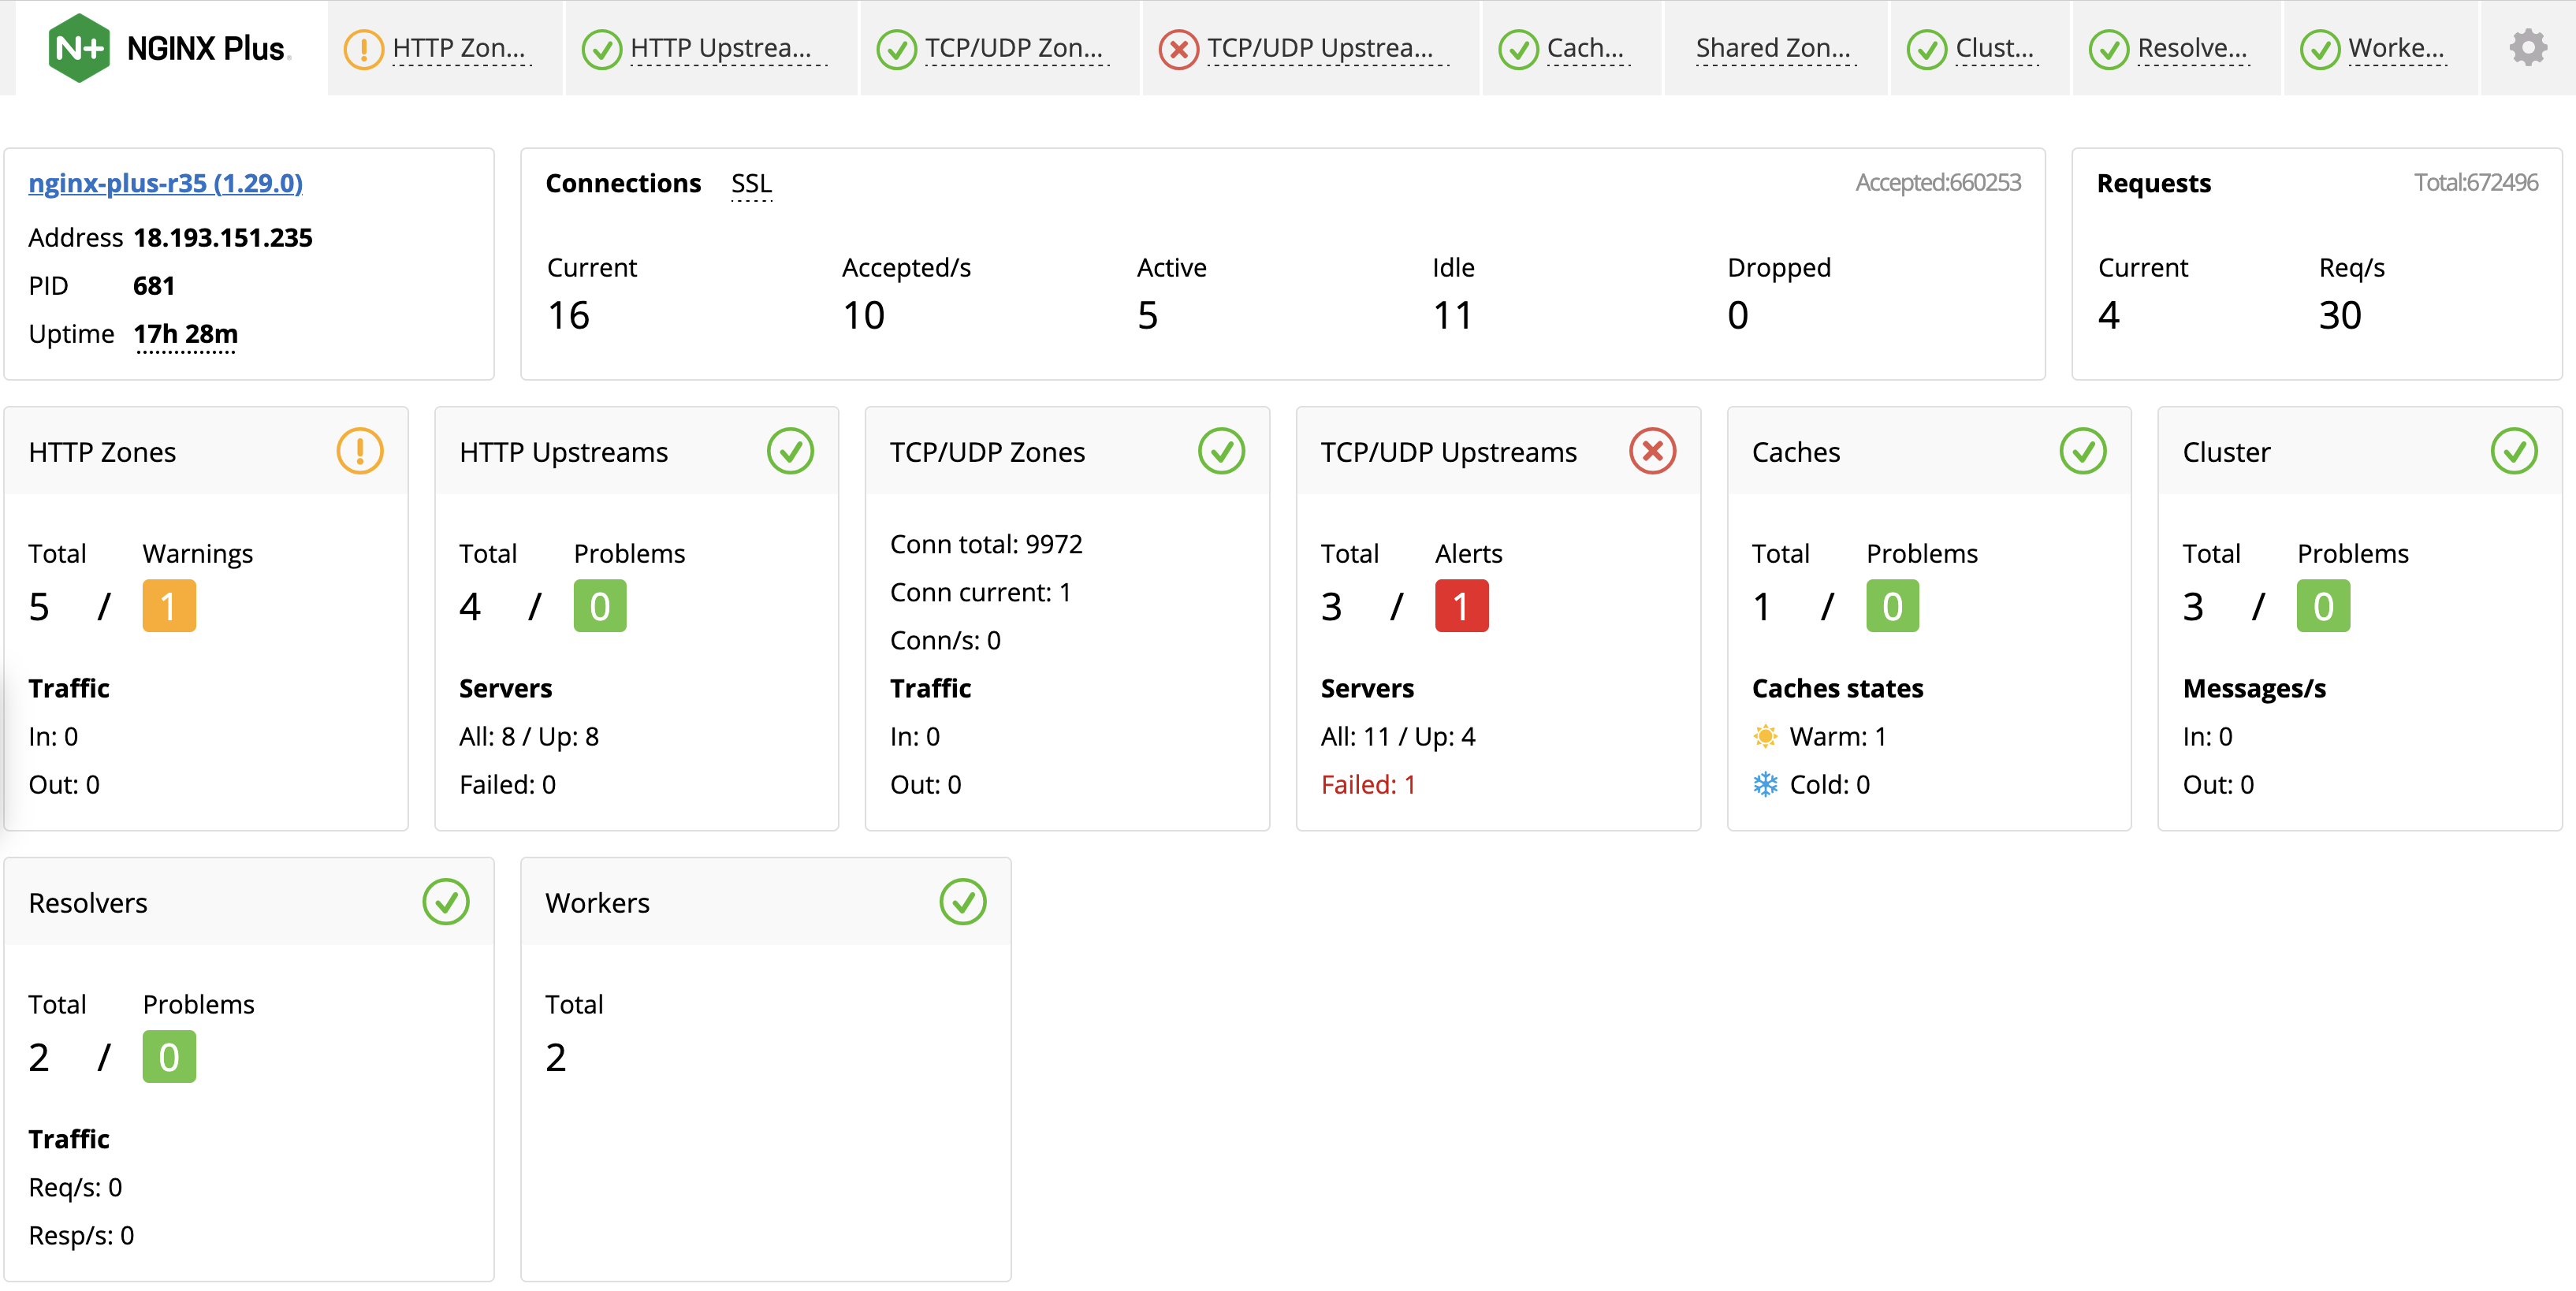
NGINX Plus Dashboard provides a real-time live activity monitoring interface that shows key load and performance metrics of your server infrastructure.
In the address bar of your browser, type-in the address that corresponds to your Dashboard page (in our example http://192.168.1.23/dashboard.html). This will display the Dashboard page located at /usr/share/nginx/html as specified in the root directive.
There is also a live demo page from NGINX available at demo.nginx.com/dashboard.html:
All information in NGINX Plus Dashboard is represented in tabs.

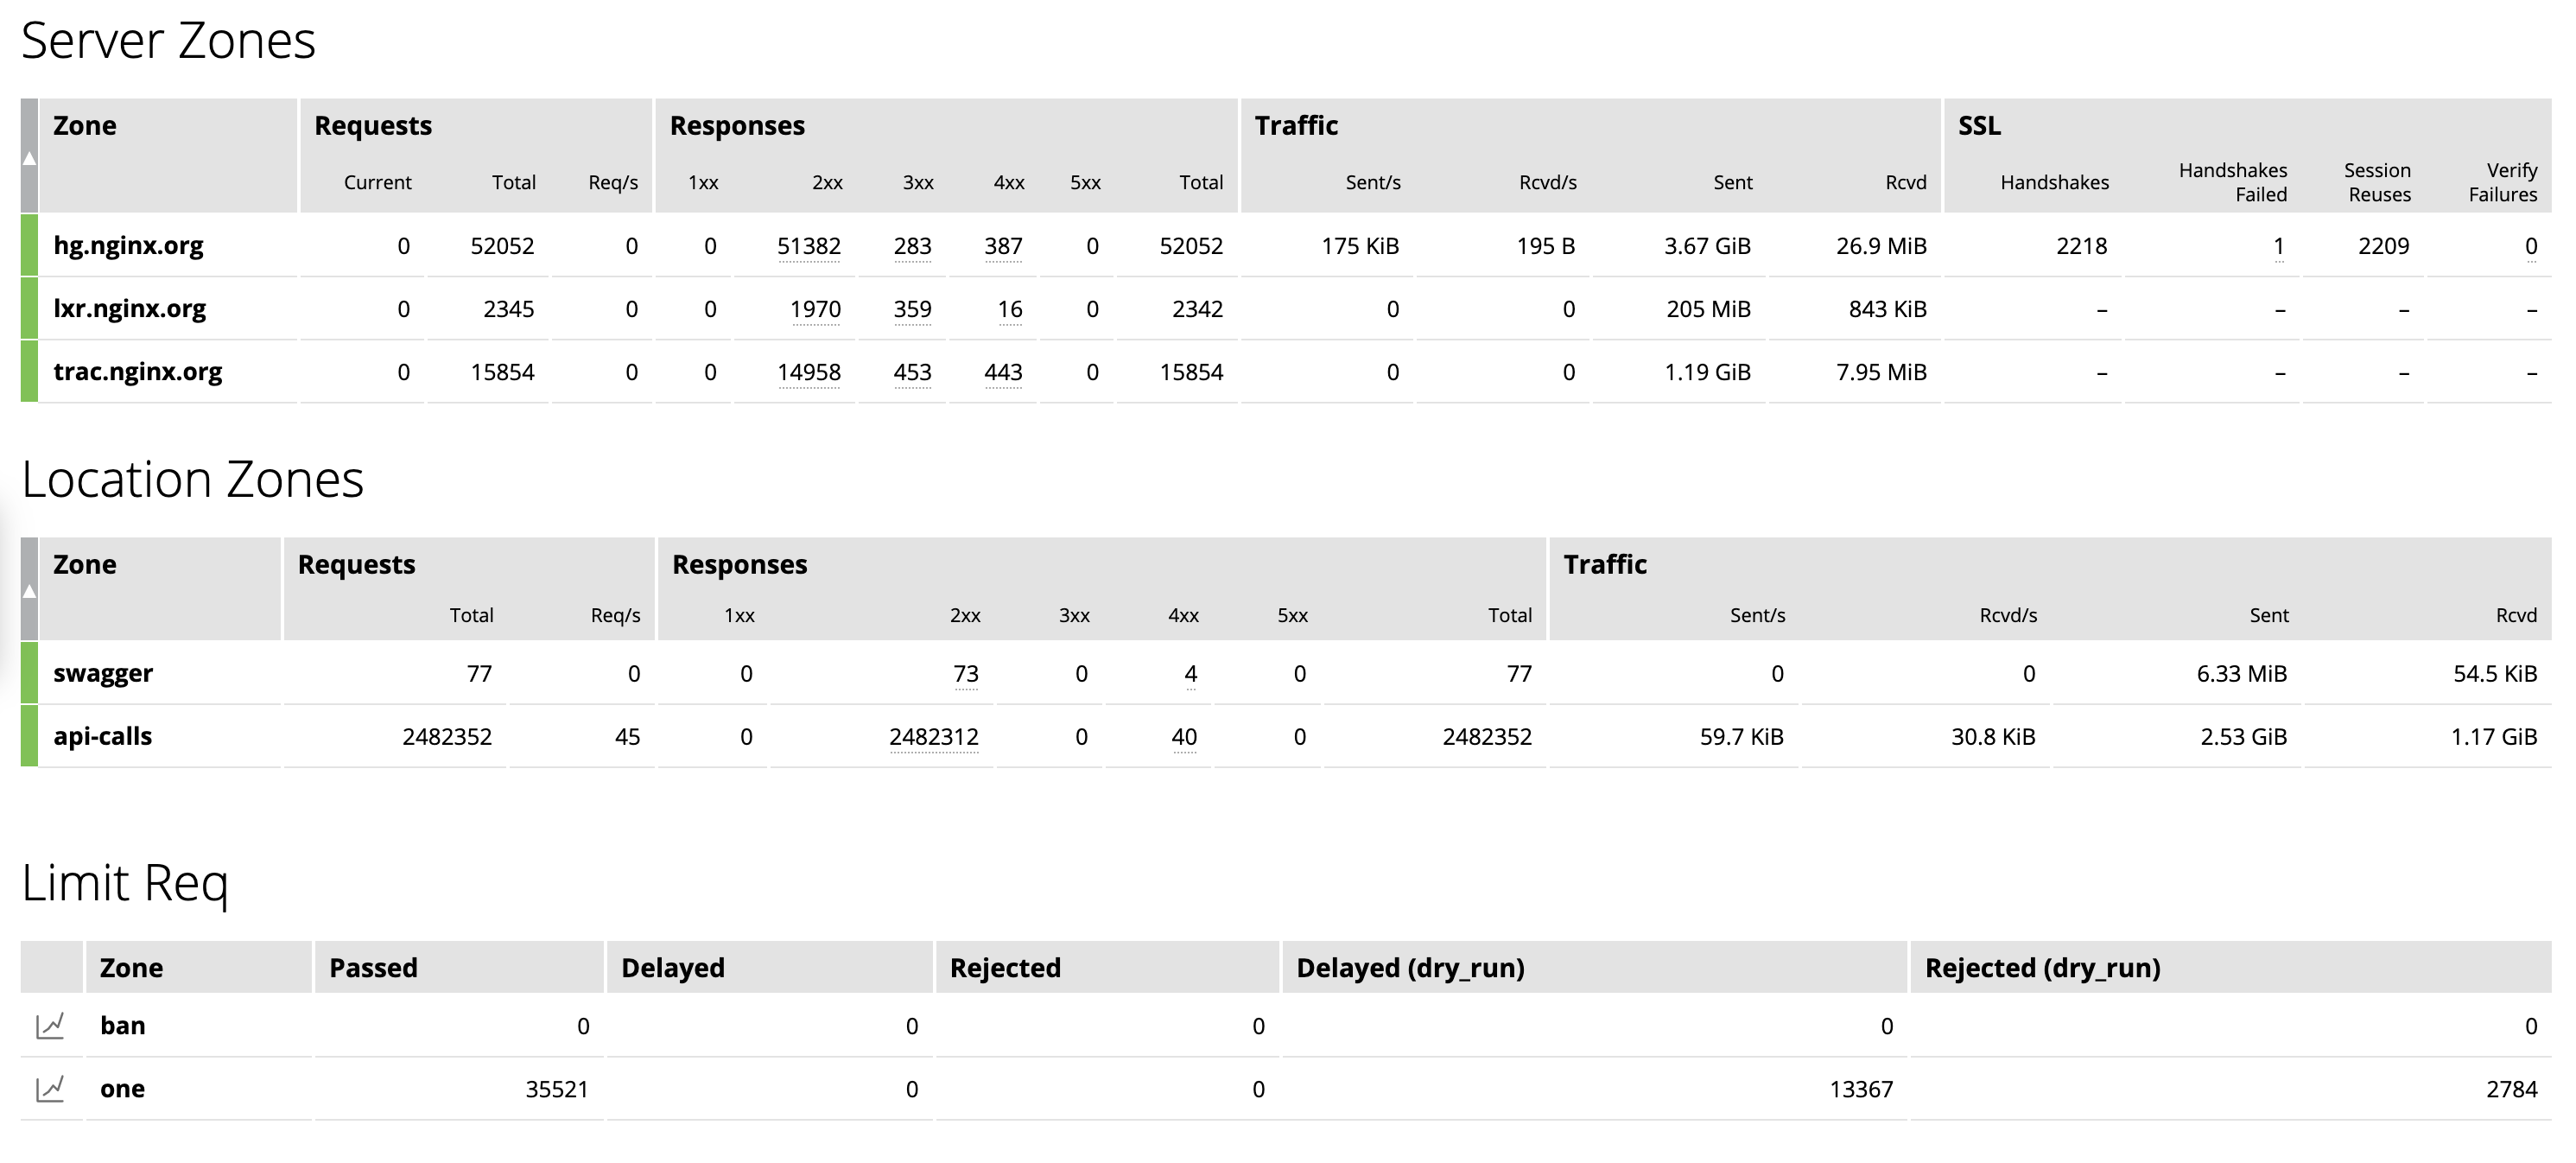
The HTTP Zones tab gives detailed statistics on the frontend performance. Statistics are shown per each server, location and limit_req zones in the http context. For NGINX Plus to collect information for each server, you must include the status_zone directive in each server or location block. To include charts for limit_req limiting, you must configure the limit_req_zone directive.
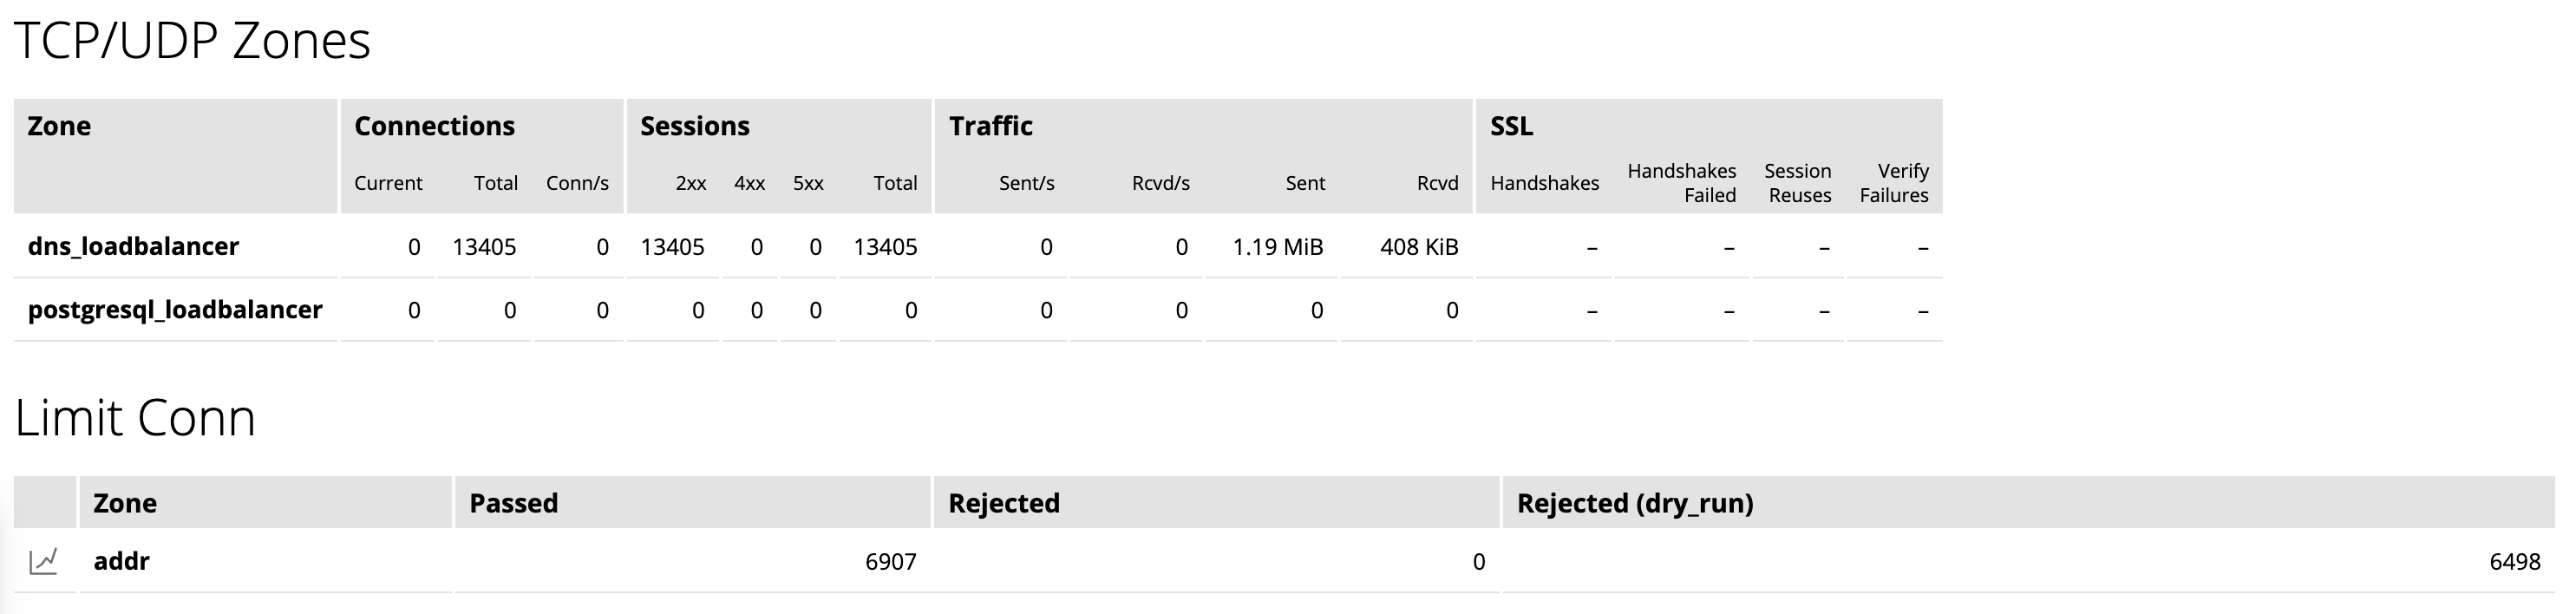
TCP and UDP status zones with charts for connection limiting (limit_conn) appear on the TCP/UDP Zones tab.
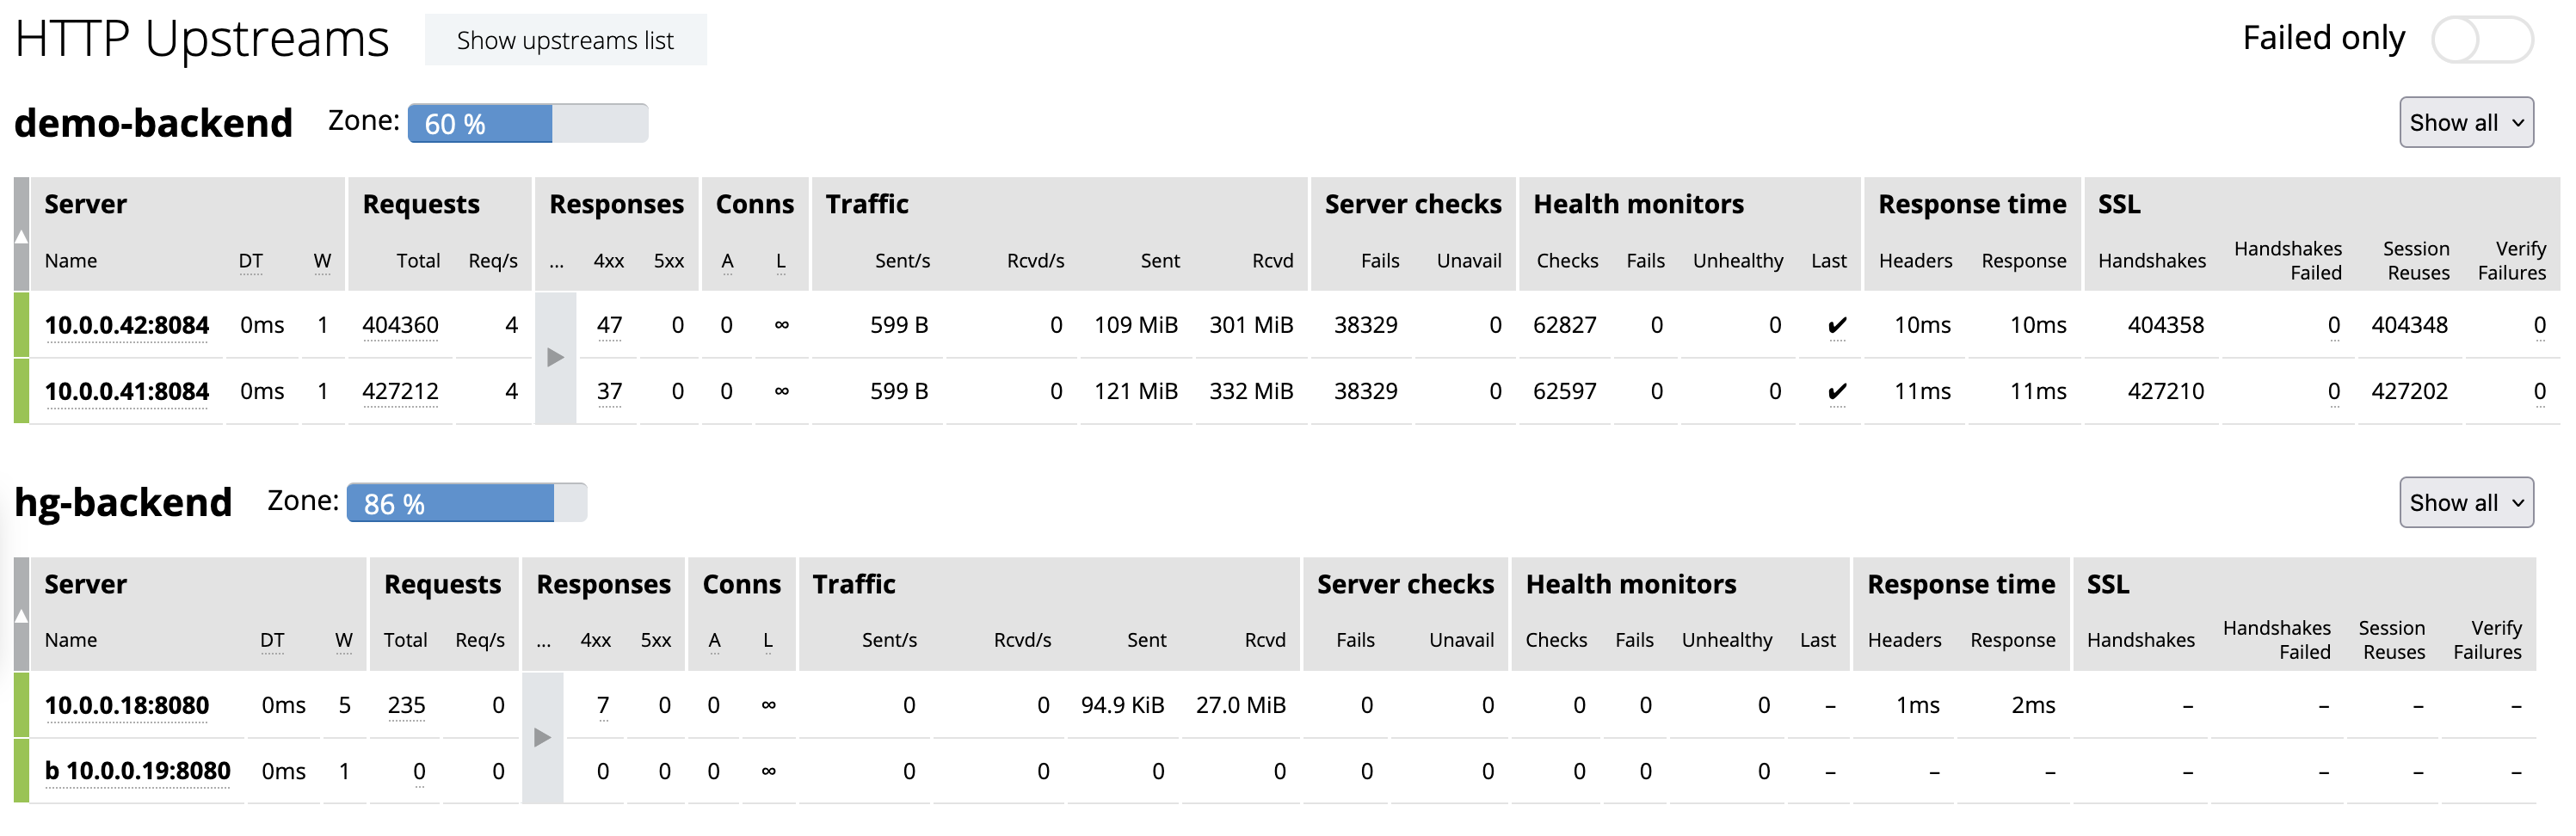
The HTTP Upstreams tab provides information about each upstream group for HTTP and HTTPS traffic. TCP and UDP upstream groups appear on the TCP/UDP Upstreams tab. For NGINX Plus to collect information for an upstream group, you must include the zone directive in the upstream configuration block.
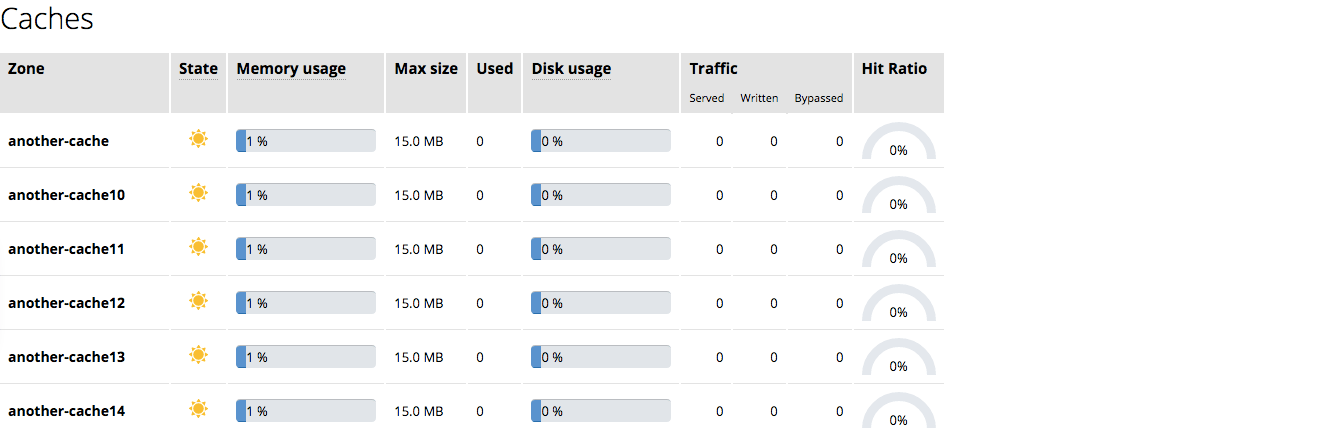
The Caches tab provides statistics about the caches configured in NGINX Plus. For NGINX Plus to collect information for an upstream group, you must configure cache.
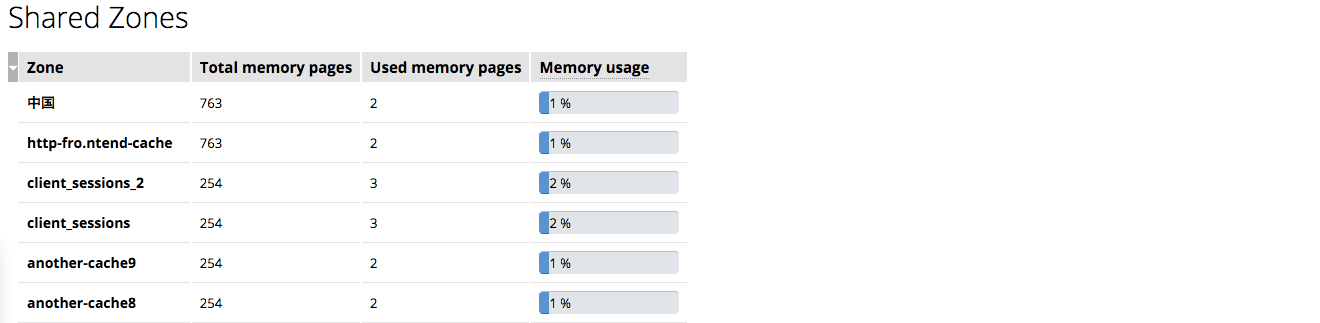
The Shared Zones tab shows how much memory is used by each shared memory zone, including cache zones, SSL session cache, upstream zones, keyval zones, session log, sticky sessions, limit_conn and limit_req zones.
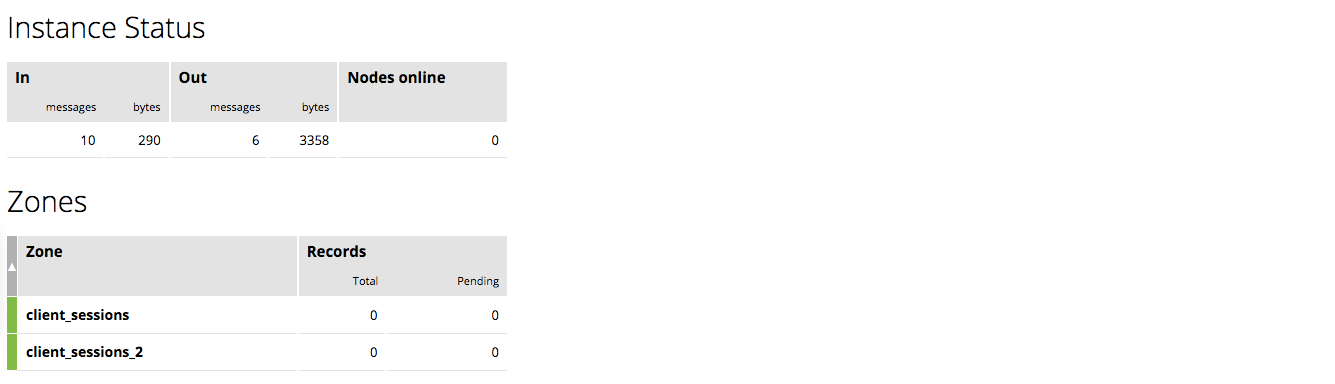
The Cluster tab provides the synchronization status of shared memory zones across all NGINX cluster nodes. See Runtime State Sharing in a Cluster for details on how to organize NGINX instances in a cluster and configure synchronization between all cluster nodes.
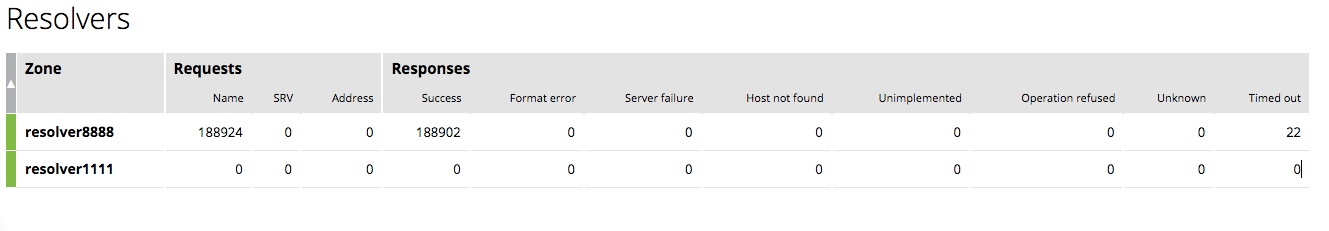
The Resolvers tab provides DNS server statistics of requests and responses per each DNS status zone. For NGINX Plus to collect information about your DNS servers, include the status_zone parameter in the resolver directive.
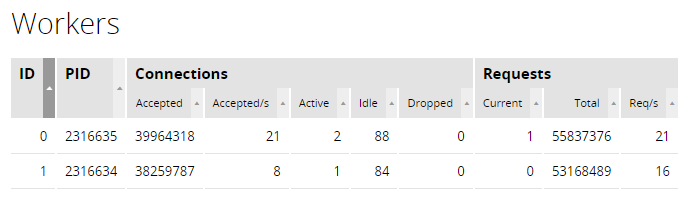
The Workers tab provides information about worker processes and shows per-worker connection statistics.
You can add new or modify and remove upstream servers directly from the Dashboard interface. Note that you must previously enable the api in the write mode.
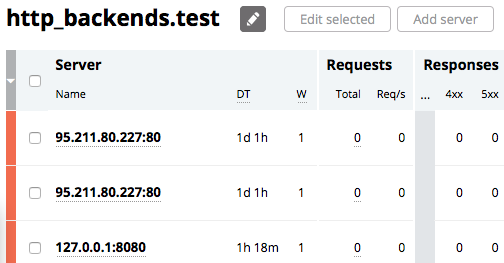
In the Upstreams or TCP/UDP Upstreams tab, click the pencil icon next to the server name and choose between Edit selected and Add server buttons:
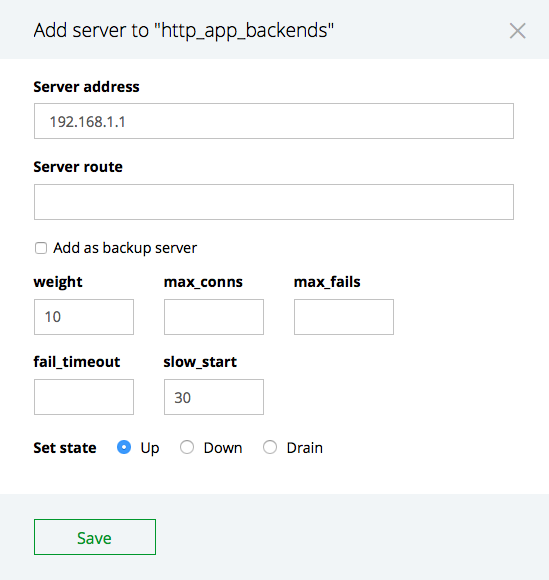
To add an upstream server, click Add server:
To remove or modify an upstream server, click the box to the left of each server’s name, then click Edit selected:
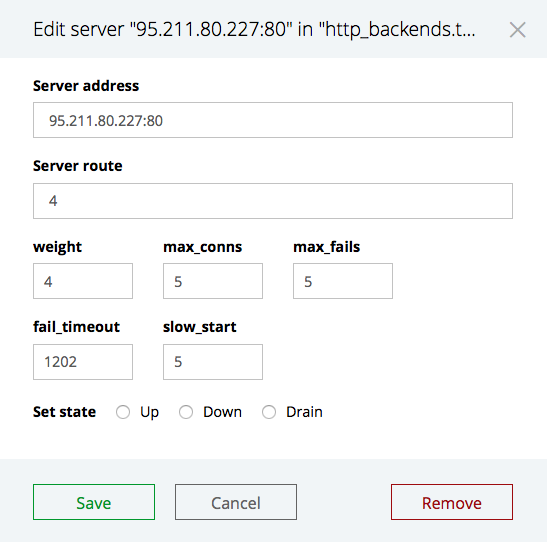
When finished, click the Save button to save the changes.
You can configure the threshold for Dashboard warnings and alerts by clicking the Gear button in the Tabs menu:
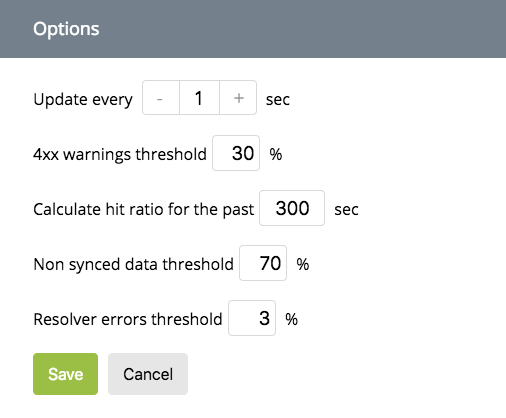
Update every N sec - updates the Dashboard data after the specified number of seconds, default is 1 second.
4xx warnings threshold - represents the ratio between the numbers of Total requests and 4xx errors for HTTP Upstreams and HTTP Zones. Default is 30%.
Calculate hit ratio for the past N sec - represents all cache hits within the specified number of seconds for Caches. Default is 300 seconds.
Not synced data threshold - represents the ratio between Pending records and Total records for Clusters. Default is 70%.
Resolver errors threshold - represents the ratio between Requests and resolver errors within the time frame specified in Update every N sec for Resolvers. Default is 3%.
With NGINX Plus, statistics of your server infrastructure can be managed with the REST API interface. The API is based on standard HTTP requests: statistics can be obtained with GET requests and reset with DELETE requests. Upstream servers can be added with POST requests and modified with PATCH requests. See Managing Upstream Servers with the API for more information.
The requests are sent in the JSON format that allows you to connect the stats to monitoring tools or dashboards that support JSON.
The status information of any element can be accessed with a slash-separated URL. The URL may look as follows:
https://demo.nginx.com/api/9/http/caches/http_cache?fields=expired,bypass
where:
/apiis the location you have configured in the NGINX configuration file for the API/9is the API version, the current API version is9/http/caches/http_cacheis the path to the resource?fields=expired,bypassis an optional argument that specifies which fields of the requested object will be output
The requested information is returned in the JSON data format.
To get the list of all available rootpoints, send the GET request with the 'curl' command in terminal (in the example, JSON pretty print extension "json_pp" is used):
curl -s 'https://demo.nginx.com/api/9/' | json_ppThe JSON data returned:
[
   "nginx",
   "processes",
   "connections",
   "slabs",
   "workers",
   "http",
   "stream",
   "resolvers",
   "ssl"
   "workers"
]
To get the statistics for a particular endpoint, for example, obtain general information about NGINX, send the following GET request:
curl -s 'https://demo.nginx.com/api/9/nginx' | json_ppThe JSON data returned:
{
   "version" : "1.29.8",
   "build" : "nginx-plus-r37.0.0",
   "address" : "206.251.255.64",
   "generation" : 14,
   "load_timestamp" : "2026-05-13T10:00:00.114Z",
   "timestamp" : "2026-05-13T14:06:36.475Z",
   "pid" : 2201,
   "ppid" : 92033
}
You can specify which fields of the requested object will be output with the optional fields argument in the request line. For example, to display only NGINX Plus version and build, specify the command:
curl -s 'https://demo.nginx.com/api/9/nginx?fields=version,build' | json_ppThe JSON data returned:
{
   "version" : "1.29.8",
   "build" : "nginx-plus-r37.0.0"
}
For a complete list of available endpoints and supported methods see reference documentation. This documentation is also available in Redoc format.
Resetting the statistics is performed by sending an API command with the DELETE method to a target endpoint. Make sure that your API is configured in the read-write mode.
You can reset the following types of statistics:
- abnormally terminated and respawned child processes
- accepted and dropped client connections
- SSL handshakes and session reuses
- the
reqsandfailsmetrics for each memory slot - total client HTTP requests
- accepted and discarded requests, responses, received and sent bytes in a particular HTTP server zone
- cache hits and cache misses in a particular cache zone
- statistics for a particular HTTP or stream upstream server in an upstream server group
For example, to reset the number of abnormally terminated and respawned child processes, you can perform the following command in the terminal via curl:
curl -X DELETE -i 'http://192.168.1.23/api/9/processes'To reset accepted and dropped client connections perform the following command:
curl -X DELETE -i 'http://192.168.1.23/api/9/connections'
The NGINX Plus REST API supports POST and PATCH HTTP methods to dynamically add a server to the upstream group or modify server parameters.
To dynamically change the configuration of an upstream group, send an HTTP request with the appropriate API method. The following examples use the curl command, but any mechanism for making HTTP requests is supported. All request bodies and responses are in JSON format.
The URI specifies the following information in this order:
- The hostname or IP address of the node that handles the request (in the following examples, 192.168.1.23)
- The location where the
apidirective appears (api) - The API version (9)
- The name of the upstream group, complete its place in the NGINX Plus configuration hierarchy represented as a slash-separated path (http/upstreams/appservers)
For example, to add a new server to the appservers upstream group, send the following curl command:
curl -X POST -d '{ \
   "server": "10.0.0.1:8089", \
   "weight": 4, \
   "max_conns": 0, \
   "max_fails": 0, \
   "fail_timeout": "10s", \
   "slow_start": "10s", \
   "backup": true, \
   "down": true \
 }' -s 'http://192.168.1.23/api/9/http/upstreams/appservers/servers'
To remove a server from the upstream group:
curl -X DELETE -s 'http://192.168.1.23/api/9/http/upstreams/appservers/servers/0'To set the down parameter for the first server in the group (with ID 0):
curl -X PATCH -d '{ "down": true }' -s 'http://192.168.1.23/api/9/http/upstreams/appservers/servers/0'The NGINX Plus OpenAPI Specification is available in several formats:
- as reference documentation
- in Redoc format
- as a YAML file
The YAML version can be used with external tools, such as Swagger UI, to explore the REST API and send API commands through a graphical interface. You can enable the Swagger UI in your environment or copy the link to the appropriate YAML file, and import it into another OpenAPI v2-compatible tool.
WarningSwagger UI and the YAML OpenAPI spec are intended for documentation and visualization of NGINX API commands only. For security reasons it is not recommended using it in a production environment.
Prior to NGINX Plus Release 25, the Swagger UI was shipped together with NGINX Plus packages. Since NGINX Plus Release 26, the OpenAPI YAML specification and the Swagger UI is published separately, below.
This table matches each OpenAPI YAML file version to the corresponding NGINX Plus release.
| OpenAPI YAML File/API Version | NGINX Plus Version | Changes |
|---|---|---|
| OpenAPI v2 for API version 9 | NGINX Plus Release PLS37.0.0 LTS | The response_time_hist data for each HTTP upstream were added |
| OpenAPI v2 for API version 9 | NGINX Plus Releases 33, 34, 35, 36 | The /license data were added |
| OpenAPI v2 for API version 9 | NGINX Plus Releases 30, 31, 32 | The /workers/ data were added |
| OpenAPI v2 for API version 8 | NGINX Plus Releases 27, 28, 29 | SSL statistics for each HTTP upstream and stream upstream, SSL statistics for each HTTP server zone and stream server zone, extended statistics for SSL endpoint |
| OpenAPI v2 for API version 7 | NGINX Plus Releases 25, 26, | The codes data in responses for each HTTP upstream, server zone, and location zone were added |
| OpenAPI v2 for API version 6 | NGINX Plus Releases 20, 21, 22, 23, 24 | The /stream/limit_conns/, /http/limit_conns/, and /http/limit_reqs/ data were added |
| OpenAPI v2 for API version 5 | NGINX Plus Release 19 | The expire parameter of a key-value pair can be set or changed, the /resolvers/ and /http/location_zones/ data were added |
| OpenAPI v2 for API version 4 | NGINX Plus Release 18 | The path and method fields of nginx error object were removed. These fields continue to exist in earlier api versions, but show an empty value |
| OpenAPI v2 for API version 3 | NGINX Plus Releases 15, 16, 17 | The /stream/zone_sync/ data were added |
| OpenAPI v2 for API version 2 | NGINX Plus Release 14 | The drain parameter was added |
| OpenAPI v2 for API version 1 | NGINX Plus Release 13 | The /stream/keyvals/ data were added |
To enable the Swagger UI:
-
Install and configure the Swagger UI. The installation package and instructions can be found on the Swagger UI page.
-
Choose the version of the OpenAPI YAML file that matches your version of NGINX Plus, download the file, and put it to the folder containing the Swagger UI files:
-
Configure NGINX Plus to work with the Swagger UI. Create a
location, for example, /swagger-ui:nginx location /swagger-ui { # ... } -
Specify the path to the Swagger UI files and the YAML spec with the
rootdirective, for example, tousr/share/nginx/html:nginx location /swagger-ui { root /usr/share/nginx/html; # ... }For NGINX Plus Release 25 and earlier, the Swagger UI is located in the root directory specified by the
rootdirective, for example, /usr/share/nginx/html. -
Restrict access to this location only from a local network with
allowanddenydirectives:nginx location /swagger-ui { root /usr/share/nginx/html; allow 192.168.1.0/24; deny all; } -
It is also recommended enabling Content Security Policy headers that define that all resources are loaded from the same origin as Swagger UI with the
add_headerdirective:nginx location /swagger-ui { add_header Content-Security-Policy "default-src 'self'"; root /usr/share/nginx/html; allow 192.168.1.0/24; deny all; }
In NGINX Plus Release 25 and earlier, the Swagger UI is a part of NGINX Plus package and is installed by default. For security reasons, you may want to block access to the Swagger UI. One of the ways to do it is to return the 404 status code in response to the URL that matches the /swagger-ui location:
location /swagger-ui {
    return 404;
}
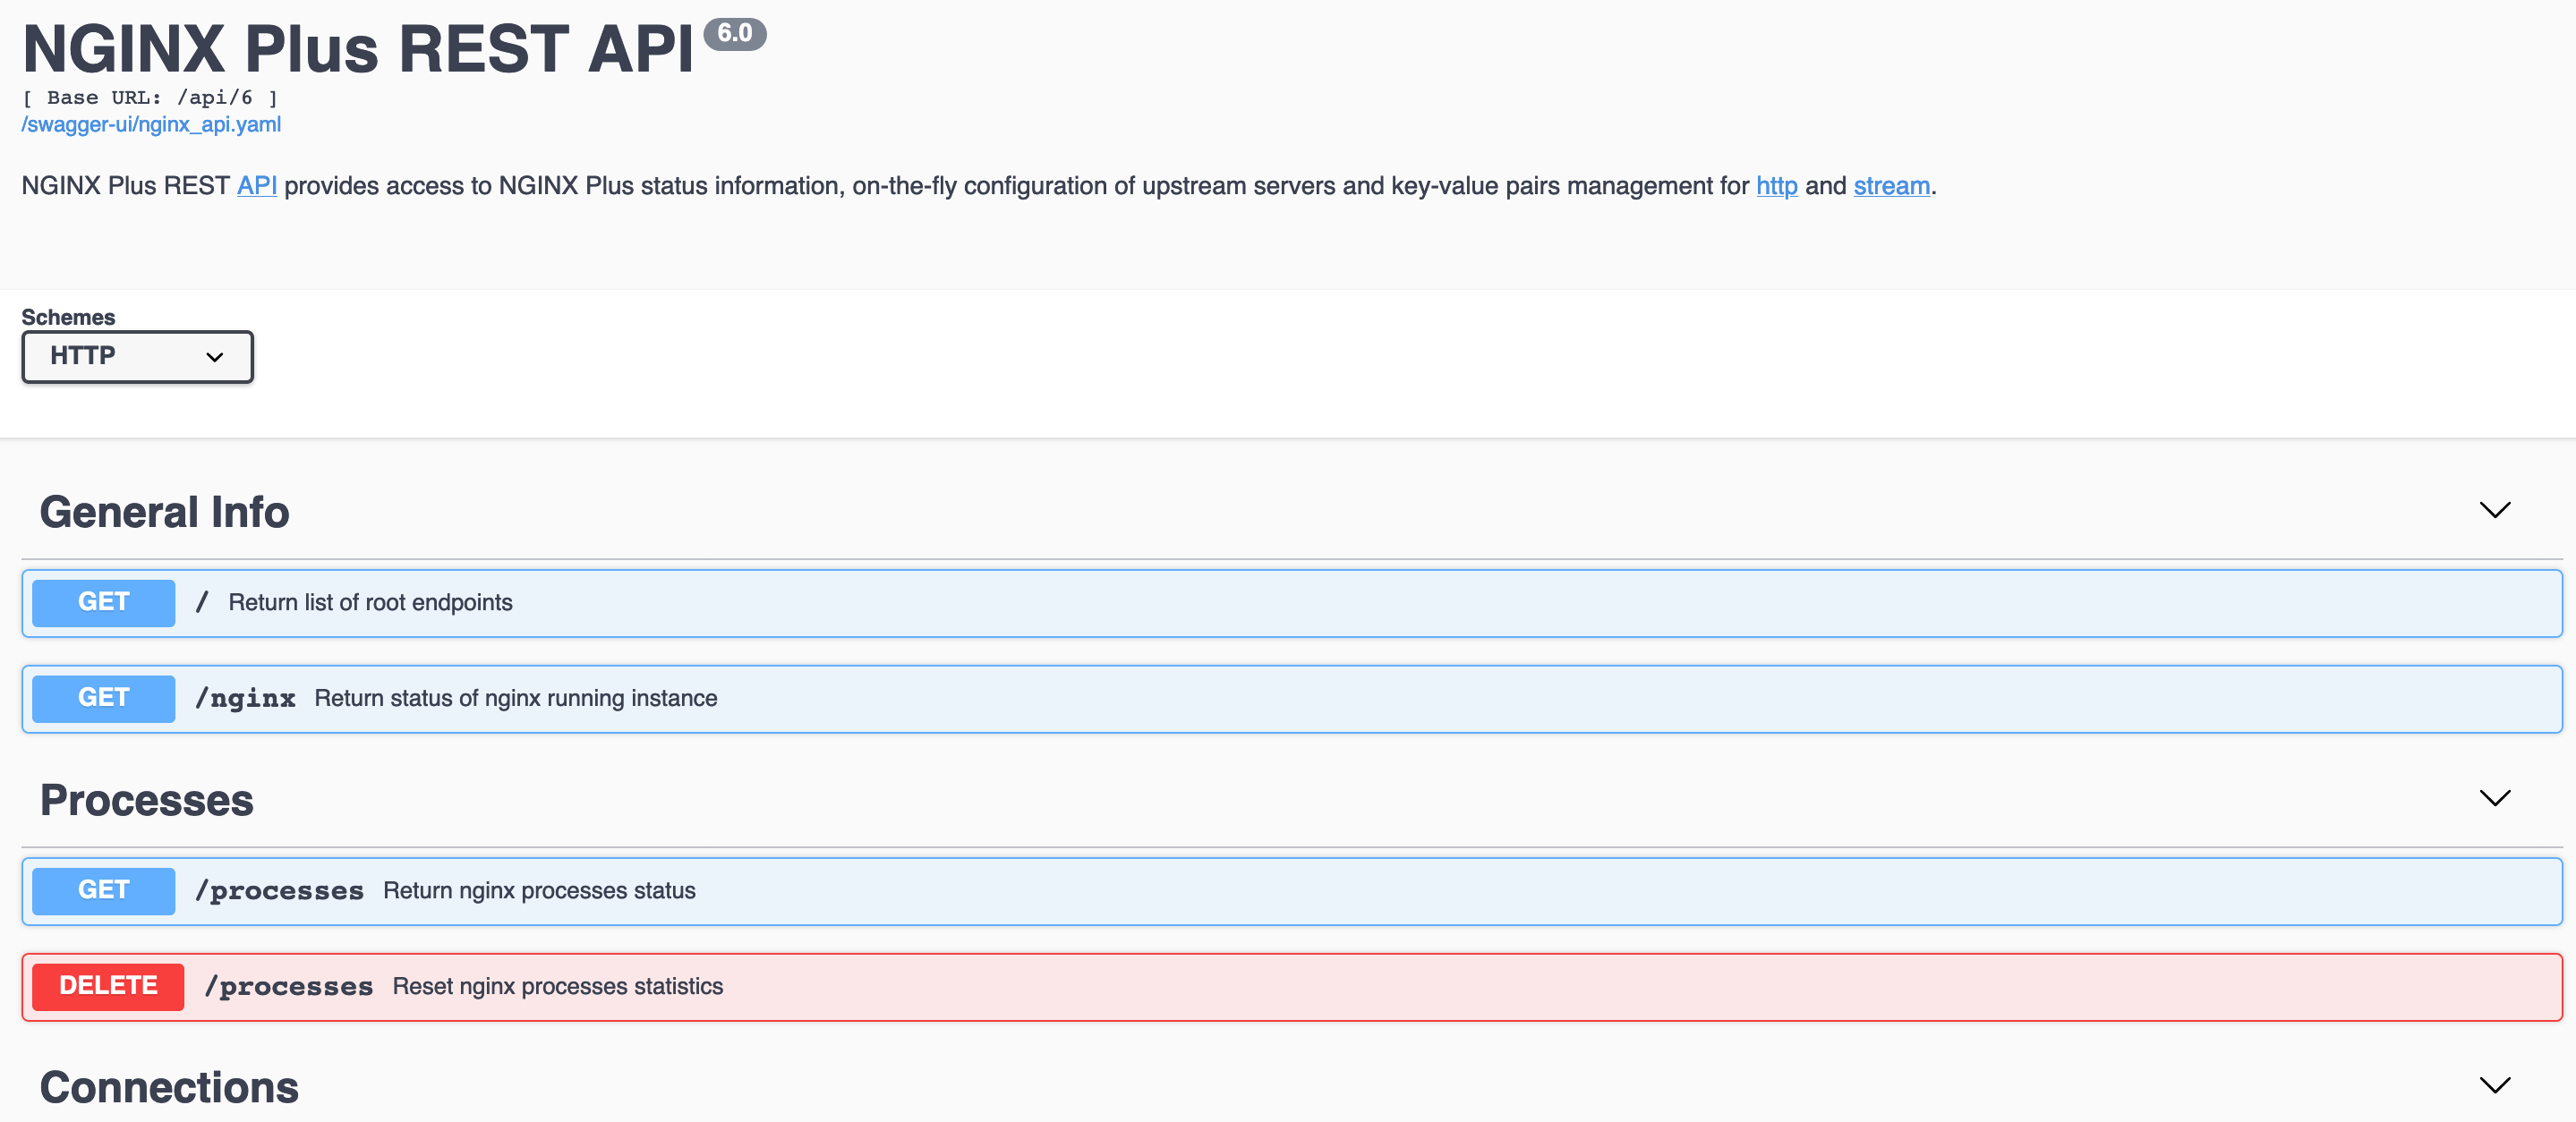
To access the Swagger UI page:
- In the address bar of your browser, type-in the address of Swagger UI, in our example the address is http://192.168.1.23/swagger-ui/:
-
If you have configured the HTTPS protocol for the Swagger UI page, you will need to choose the "HTTPS" scheme in the "Schemes" menu.
-
Click on the operation you want to fulfill.
-
Click Try it out.
-
Fill in the obligatory fields, if required. Generally, the required field is the name of the shared memory zone.
-
As an option you can display only particular fields. In the "Fields" line specify the fields you want to be displayed separated by commas. If no fields are specified, then all fields are displayed.
-
Click Execute. The result and the corresponding HTTP error code will be displayed below the Execute command.
NGINX provides live examples of JSON data and Swagger UI on a demo website.
Live example of JSON data is available at: https://demo.nginx.com/api/9/
You can send an API command with curl or with a browser:
curl -s 'https://demo.nginx.com/api/9/'
curl -s 'https://demo.nginx.com/api/9/nginx?fields=version,build'
curl -s 'https://demo.nginx.com/api/9/http/caches/http_cache'
curl -s 'https://demo.nginx.com/api/9/http/upstreams/'
curl -s 'https://demo.nginx.com/api/9/http/upstreams/demo-backend'
curl -s 'https://demo.nginx.com/api/9/http/upstreams/demo-backend/servers/0'
The Swagger UI demo page is available at: https://demo.nginx.com/swagger-ui/
Live examples operate in the read-only mode, resetting the statistics via the DELETE method and creating/modifying upstream servers with the POST/PATCH methods are not available. Also note that as the demo API is served over the HTTP protocol, it is required to choose the “HTTP” scheme in the “Schemes” menu on the Swagger UI demo page.