Enable F5 WAF for NGINX Logs
F5 NGINXaaS for Azure (NGINXaaS) supports exporting F5 WAF for NGINX logs to an Azure Storage account or to a Log Analytics workspace.
F5 WAF for NGINX operational logs are sent to the NGINX error logs. See Enable NGINX Logs to configure error logs.
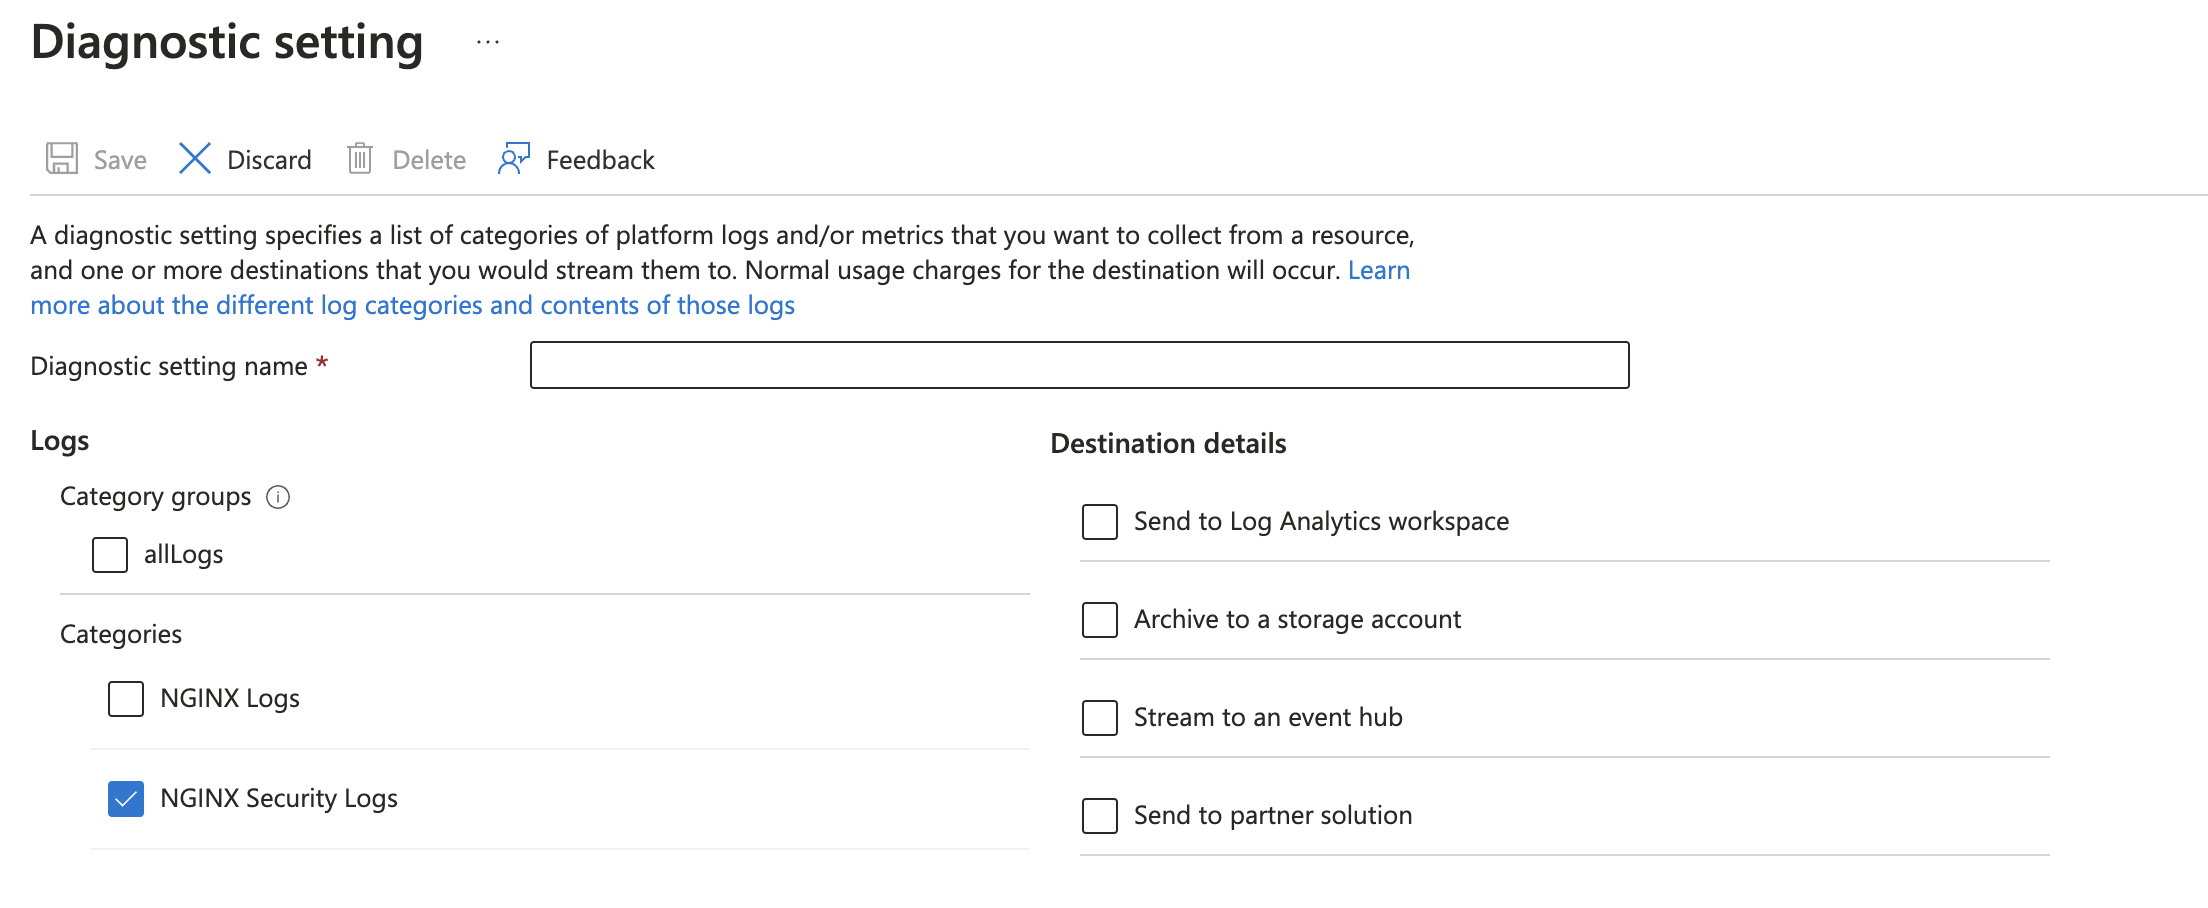
- Enable the NGINX Security Logs category in Diagnostic Settings. For more information on logging, see Enable NGINX Logs.
- Update your NGINX configuration to enable security logs in an http/server/location context.
app_protect_security_log_enable on;- Configure the log configuration path and destination to the
app_protect_security_logdirective. More information on supported log configurations and destination can be found in the following sections.
app_protect_security_log "/etc/app_protect/conf/log_all.json" syslog:server=localhost:5140;Sample NGINX config with security logs enabled:
user nginx;
worker_processes auto;
worker_rlimit_nofile 8192;
pid /run/nginx/nginx.pid;

load_module modules/ngx_http_app_protect_module.so;

events {
    worker_connections 4000;
}

error_log /var/log/nginx/error.log debug;

http {
    access_log off;
    server_tokens "";

    app_protect_enforcer_address 127.0.0.1:50000;

    server {
        listen 80 default_server;

        location / {
            app_protect_enable on;
            app_protect_policy_file /etc/app_protect/conf/NginxDefaultPolicy.tgz;
            app_protect_security_log_enable on;
            app_protect_security_log "/etc/app_protect/conf/log_all.tgz" syslog:server=localhost:5140;
            proxy_pass http://127.0.0.1:80/proxy/$request_uri;
        }

        location /proxy {
            default_type text/html;
            return 200 "Hello World\n";
        }
    }
}
You can find more details on these directives in the Security log documentation.
NGINXaaS for Azure ships with several pre-compiled log configuration bundles. More details on these logging bundles can be found in the Security log documentation.
The following table shows the path to the log configuration file that needs to be used with the app_protect_security_log directive:
| Profile | Path |
|---|---|
| log_default | /etc/app_protect/conf/log_default.json |
| log_all | /etc/app_protect/conf/log_all.json |
| log_illegal | /etc/app_protect/conf/log_illegal.json |
| log_blocked | /etc/app_protect/conf/log_blocked.json |
| log_grpc_all | /etc/app_protect/conf/log_grpc_all.json |
| log_grpc_illegal | /etc/app_protect/conf/log_grpc_illegal.json |
| log_grpc_blocked | /etc/app_protect/conf/log_grpc_blocked.json |
To view the contents of the available log configuration, navigate to the azure portal and select the Log Configurations tab in the F5 WAF for NGINX section.
- Logging to NGINXaaS syslog (Recommended)
NGINXaaS for Azure supports a local syslog server running on port 5140. Syslogs forwarded to this destination are sent to the sink configured in the Diagnostic Setting section.
app_protect_security_log "/etc/app_protect/conf/log_all.json" syslog:server=localhost:5140;When using a NGINXaaS syslog destination, the syslog server destination needs to match localhost:5140. Configuring log directives to other syslog locations will result in an error in the NGINX config.
- File Logging
NGINXaaS for Azure supports logging to a file path. Any logs written under /var/log/app_protect will be sent to the sink configured in Diagnostic Setting.
app_protect_security_log "/etc/app_protect/conf/log_all.json" /var/log/app_protect/security.log;When using a file destination, the configured path for nginx security logs has to be within/var/log/app_protect. Configuring log directives to other file locations will result in an error in the NGINX config.
If the diagnostic setting destination details included a Logs Analytics workspace, logs appear in the "NGXSecurityLogs" table with the following columns:
| Attribute | Description |
|---|---|
| Location | The location of the NGINXaaS resource. |
| Message | The generated NGINX security log line. |
| FilePath | The path to which NGINX security logs are configured to be logged to if the nginx config uses file-based logs. |
| Tag | The tag with which NGINX security logs are generated if syslog-based log configuration is used. |
| Facility | The syslog facility that generates the NGINX security logs if syslog-based log configuration is being used. |
| Severity | The syslog severity with which NGINX security logs were generated if syslog-based log configuration is used. |
To view the raw data in the NGINX security log, run the following KQL query:
NGXSecurityLogs
| extend JSONLog = extract(@"json_log\s*=\s*""({.*?})""", 1, Message)
| extend Log = parse_json(replace_string(JSONLog, '""', '"'))
| project Log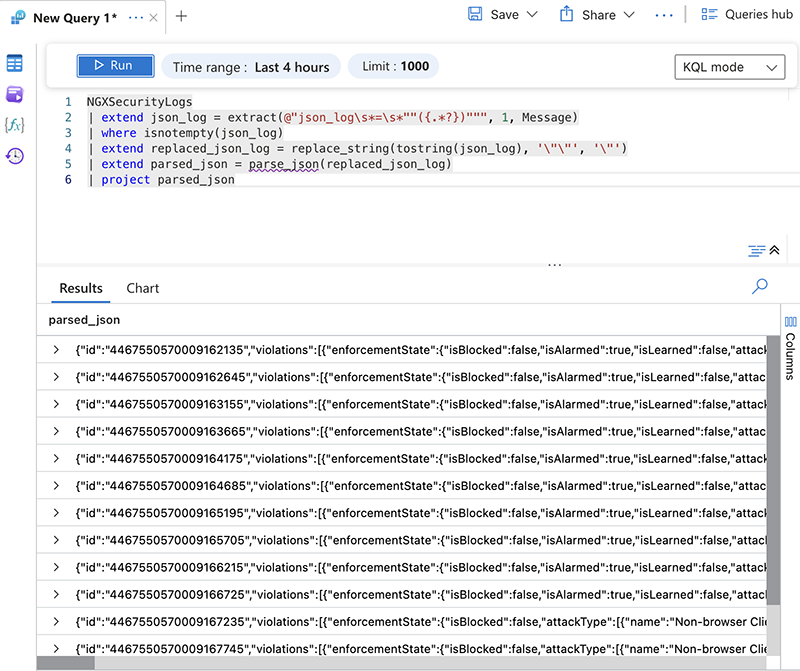
The following sample queries will help you get started with creating visualizations based on security logs.
Blocked requests by IP
NGXSecurityLogs
| extend JSONLog = extract(@"json_log\s*=\s*""({.*?})""", 1, Message)
| extend Log = parse_json(replace_string(JSONLog, '""', '"'))
| where Log.enforcementAction == "block"
| project ClientIP = tostring(Log.clientIp), TimeGenerated
| summarize count() by ClientIP, bin(TimeGenerated, 1m)
| render timechart
Blocked requests by URL
NGXSecurityLogs
| extend JSONLog = extract(@"json_log\s*=\s*""({.*?})""", 1, Message)
| extend Log = parse_json(replace_string(JSONLog, '""', '"'))
| where Log.enforcementAction == "block"
| project URL = tostring(Log.url), TimeGenerated
| summarize count() by URL, bin(TimeGenerated, 1m)
| render timechart
Top matched rules
NGXSecurityLogs
| extend JSONLog = extract(@"json_log\s*=\s*""({.*?})""", 1, Message)
| extend Log = parse_json(replace_string(JSONLog, '""', '"'))
| where Log.enforcementAction == "block"
| project attackType = Log.enforcementState.attackType, TimeGenerated
| mv-expand attackType
| project attackName = tostring(attackType.name), TimeGenerated
| summarize count() by attackName, bin(TimeGenerated, 1m)
| render timechart
To add a visualization to a dashboard, select the Pin to dashboard icon in the top right of the log analytics workspace.
It can take up to 90 minutes after adding diagnostic settings for logs to appear in the provided Logs Analytics Workspace.