NGINX Plus dashboard
Learn how to view the NGINX Plus dashboard to see real-time metrics.
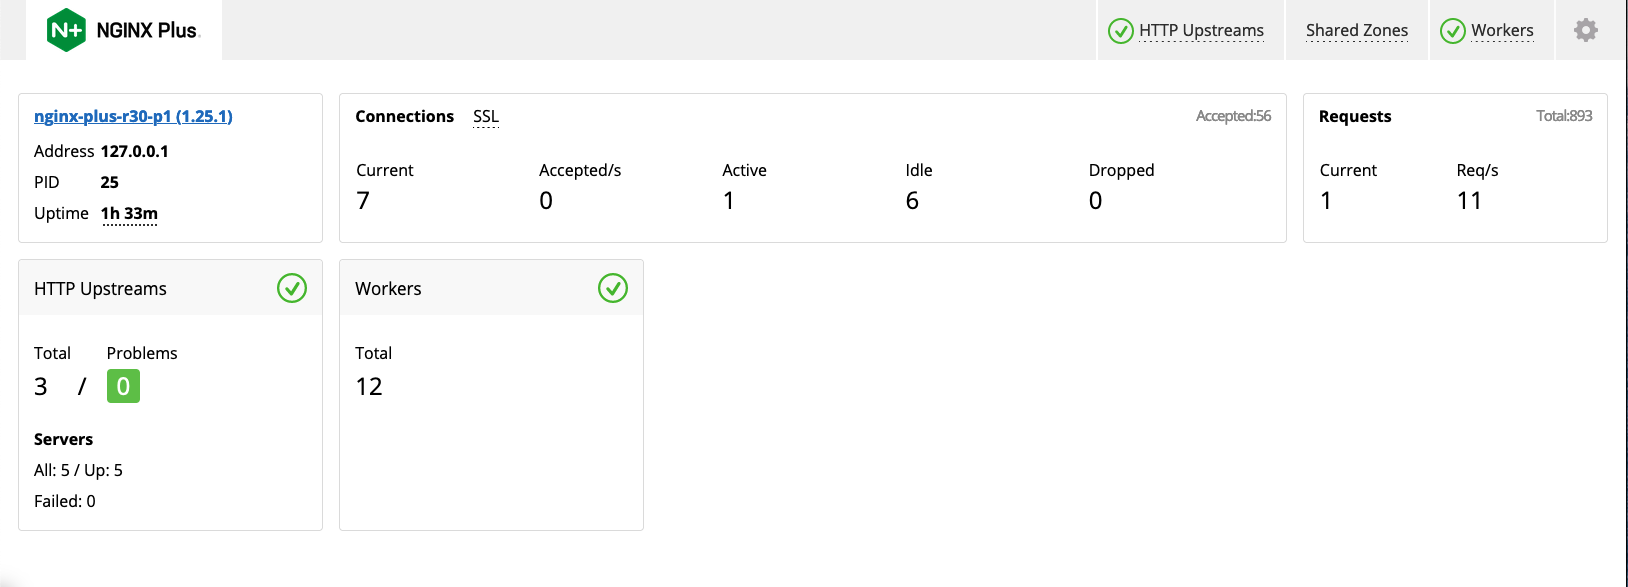
The NGINX Plus dashboard offers a real-time live activity monitoring interface that shows key load and performance metrics of your server infrastructure. The dashboard is enabled by default for NGINX Gateway Fabric deployments that use NGINX Plus as the data plane. The dashboard is available on port 8765.
To access the dashboard:
-
Use port-forwarding to forward connections to port 8765 on your local machine to port 8765 on the NGINX Gateway Fabric pod (replace
<nginx-gateway-fabric-pod>with the actual name of the pod).kubectl port-forward <nginx-gateway-fabric-pod> 8765:8765 -n nginx-gateway -
Open your browser to http://127.0.0.1:8765/dashboard.html to access the dashboard.
The dashboard will look like this:
Note: The API used by the dashboard for metrics is also accessible using the/apipath.