Graphs
Learn about the Graphs page of the User Interface.
On the Graphs page, you can find a collection of predefined graphs. Here you can see an overview of the key metric stats, such as CPU, memory, and disk usage for all your systems.
If you click on a system on the left, the graphs will change to reflect the metrics for the selected system. The graphs are further split into tabs such as “System”, “NGINX” and so on.
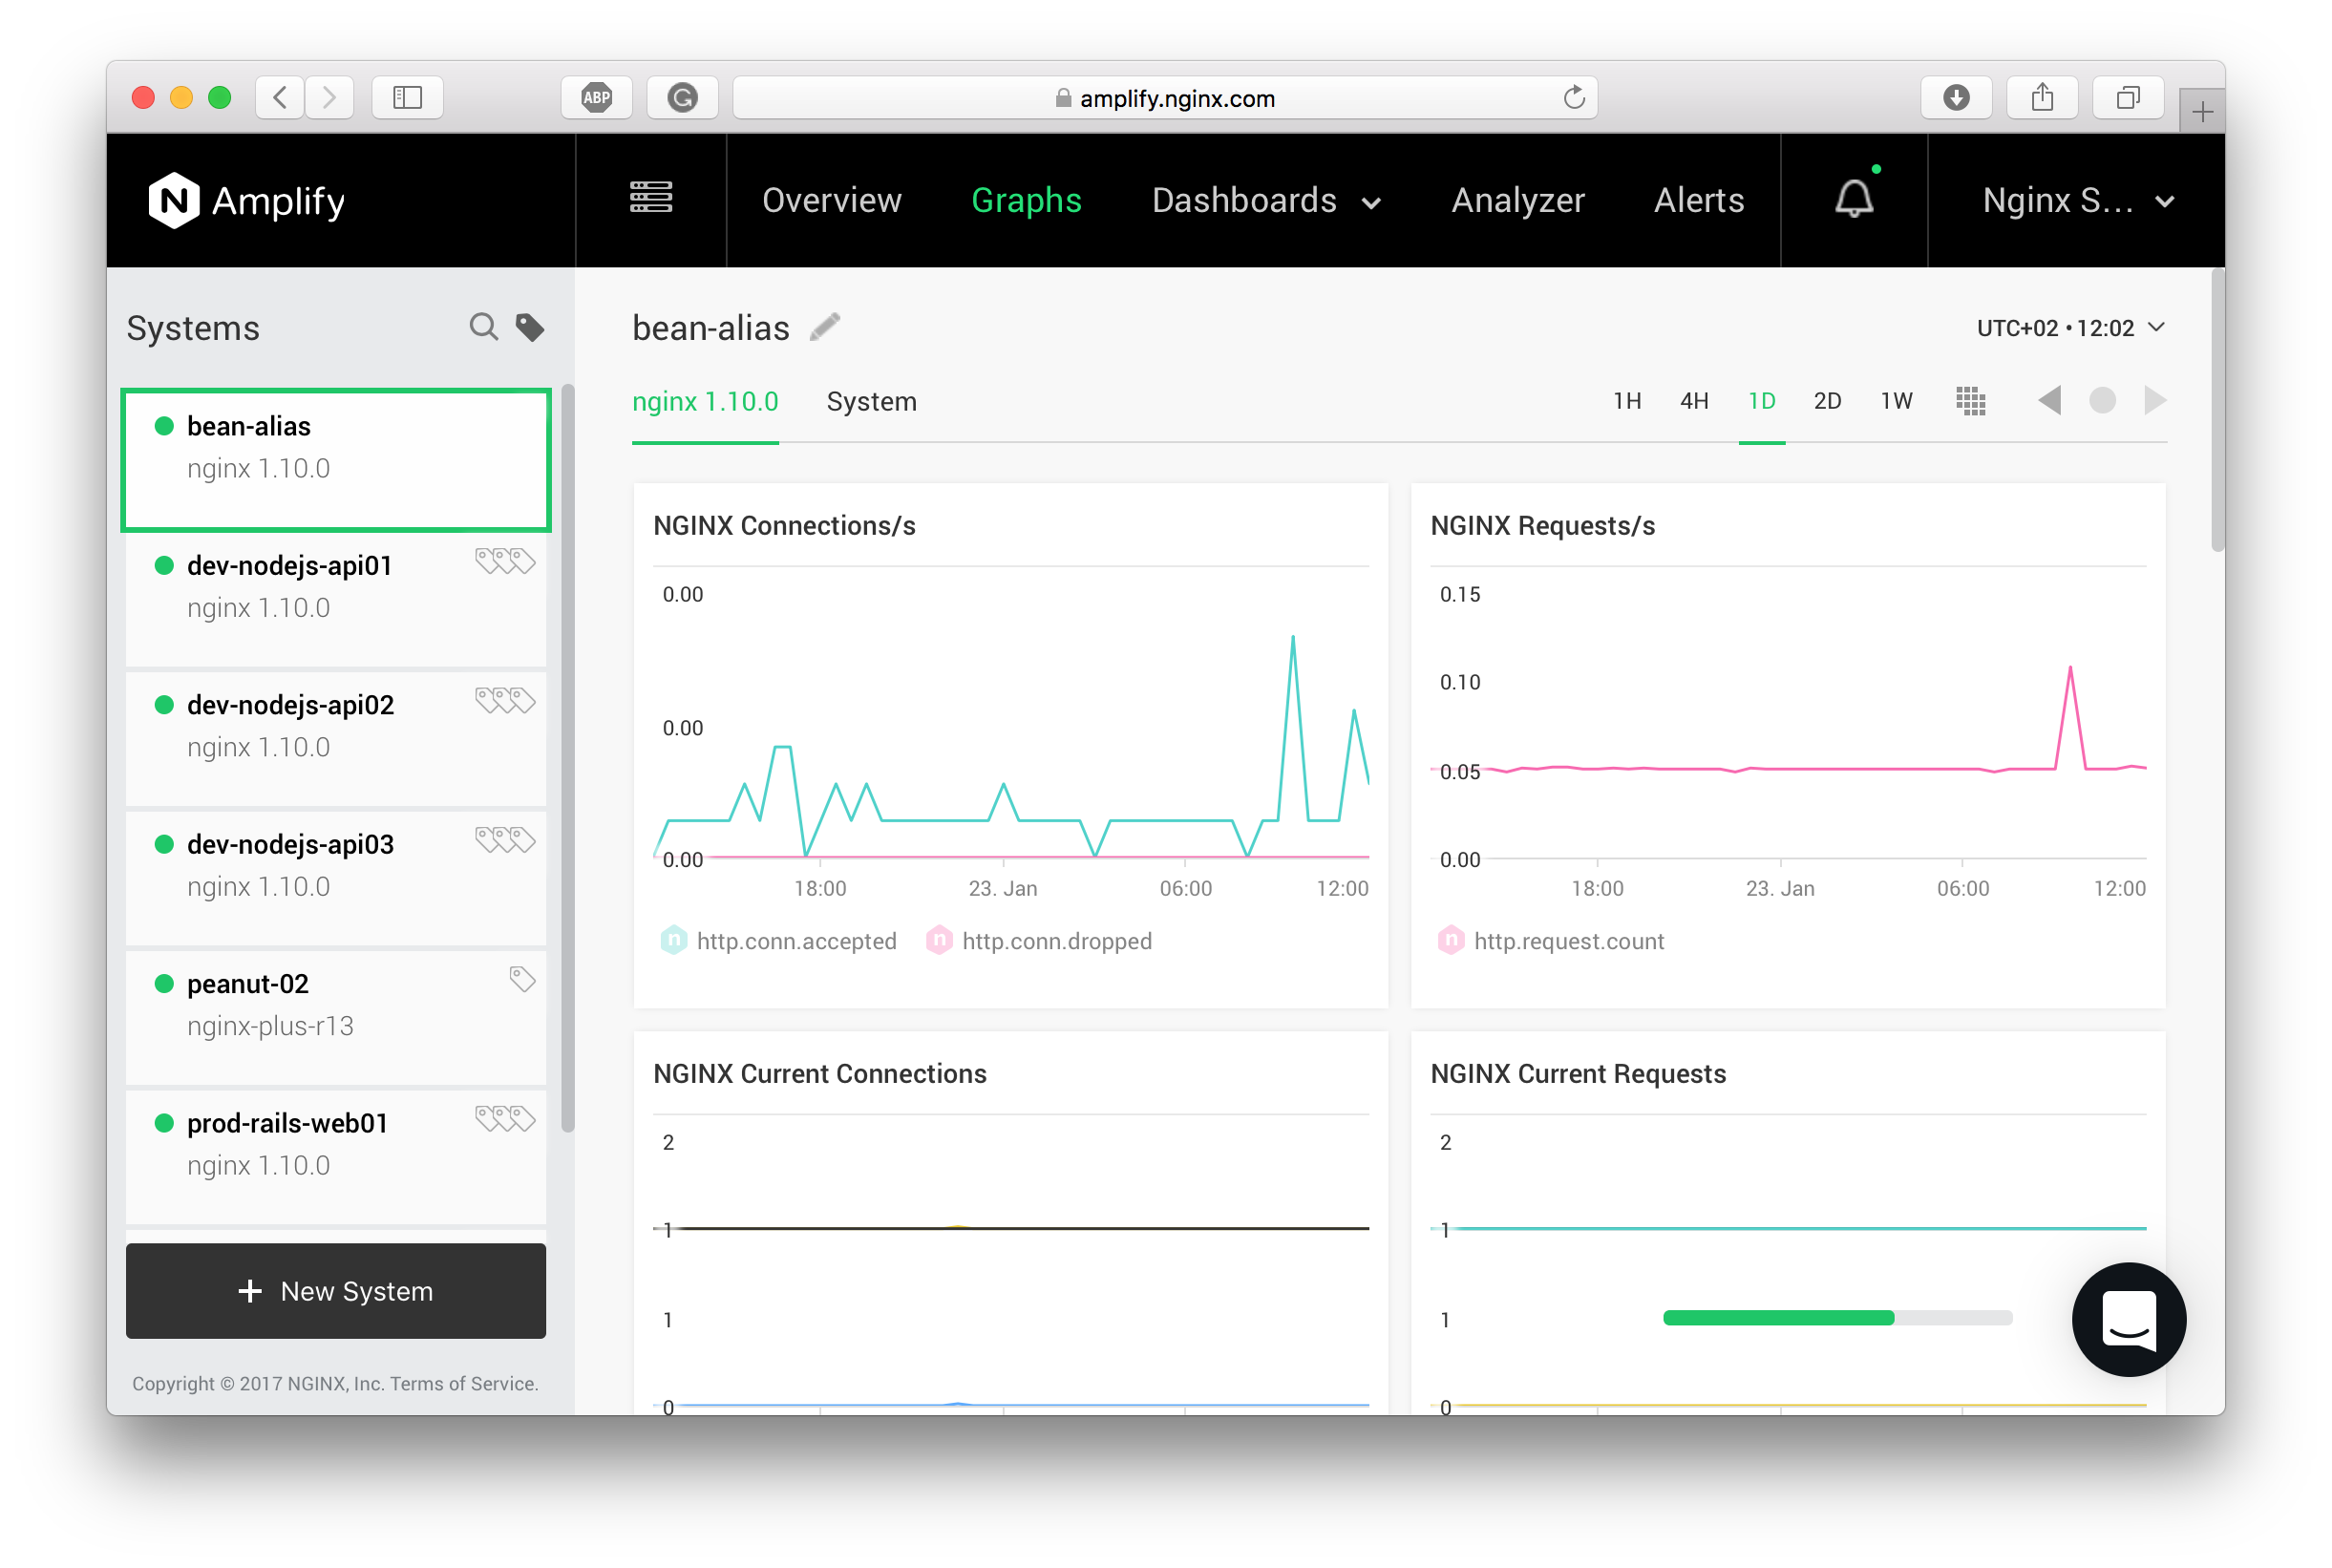
Some graphs have an additional selector. E.g., with “Disk Latency” or “Network Traffic” you can select what device or interface you’re analyzing.
Above the graphs, you will find the following:
- Hostname or alias for the selected system
- System properties editor where you can set up an alias for the host and assign host tags
- List of tags assigned to the system
- Time range selector, which helps to display different time periods for the graphs
- Time zone selector
You can also copy a predefined graph to a custom dashboard by focusing on the graph and clicking on the arrow in the top right corner.
Check the Metrics and Metadata documentation to learn more about the displayed metrics.