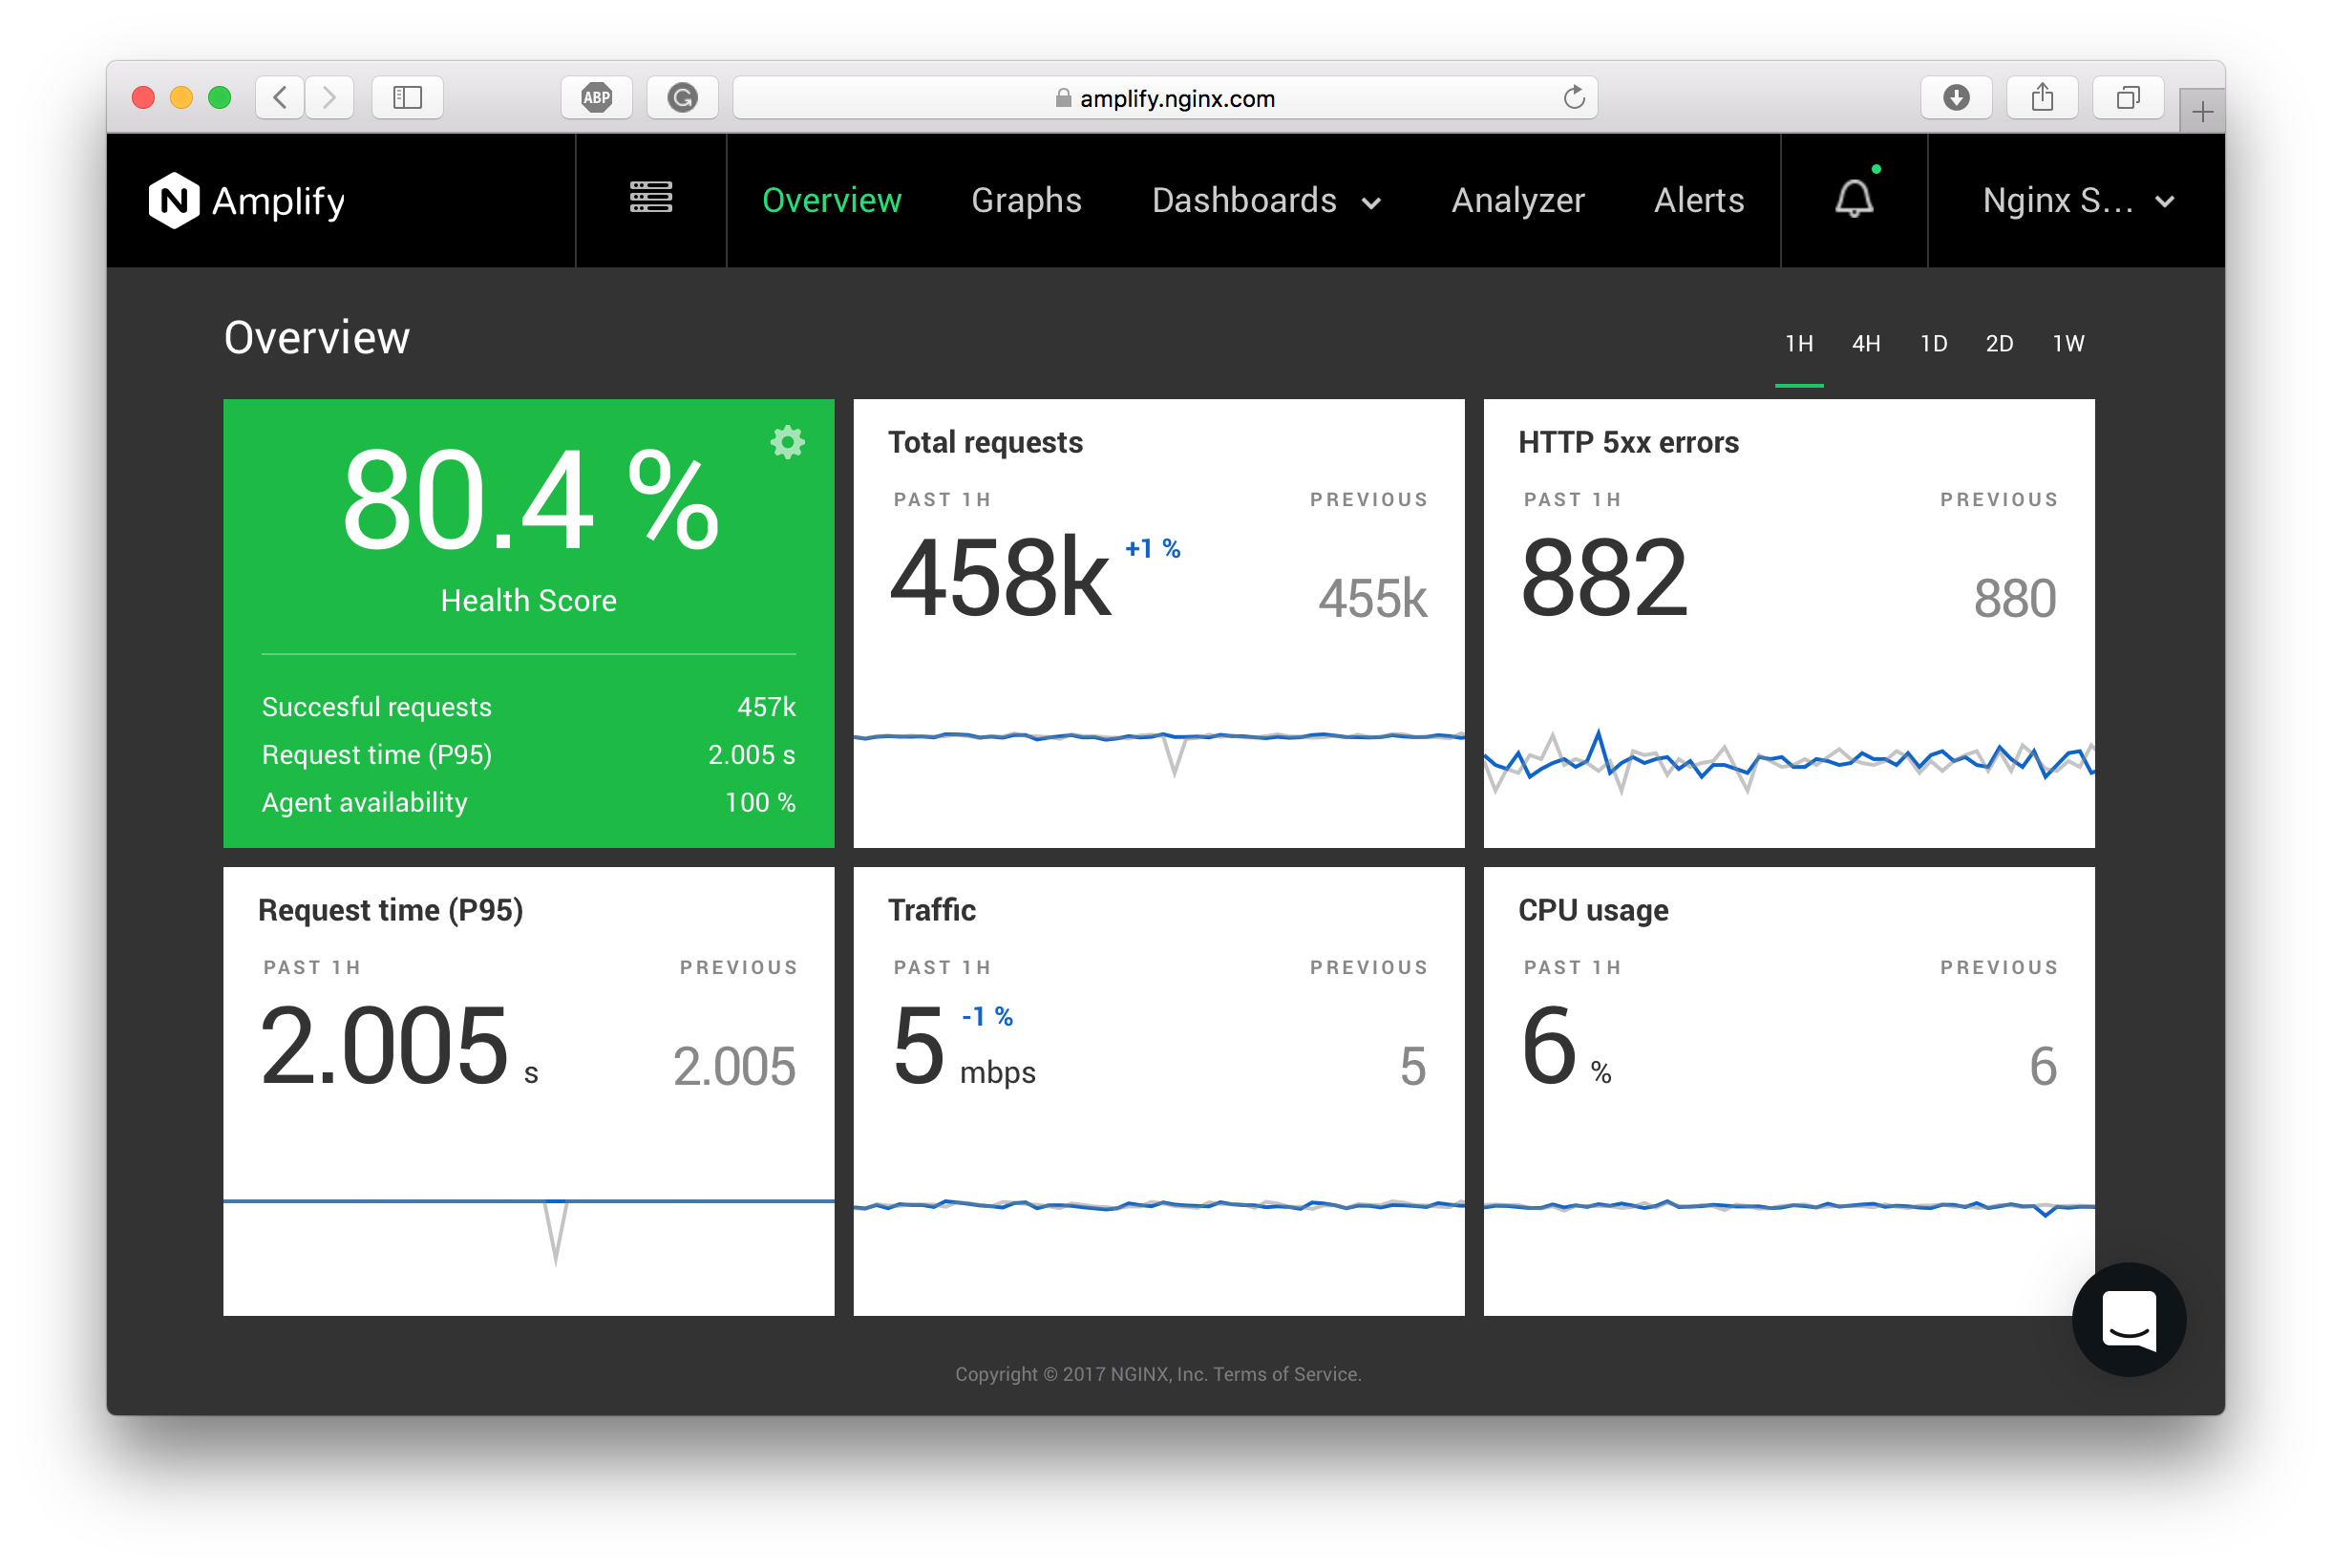
Overview
Learn about the Overview page of the User Interface.
The Overview page is designed to provide a quick summary of the state of your NGINX infrastructure. Here you can quickly check the total sum of HTTP 5xx errors over the past 24 hours and compare it to the previous 24 hours.
Five key overlay graphs are displayed for the selected period. By switching over various periods, you can compare trends and see if anything abnormal shows up.
The cumulative metrics displayed on the Overview page are:
- Total requests — sum of nginx.http.request.count
- HTTP 5xx errors — sum of nginx.http.status.5xx
- Request time (P95) — average of nginx.http.request.time.pctl95
- Traffic — sum of system.net.bytes_sent rate
- CPU Usage — average of system.cpu.user
Note:
By default the metrics above are calculated for all monitored hosts. You can configure specific tags in the Overview settings popup to display the metrics for a set of hosts (e.g. only the “production environment”).
You may see zero numbers if some metrics are not being gathered, e.g., if the request time (P95) is 0.000s, please check that you have correctly configured NGINX log for additional metric collection.

Application Health Score
The upper left block displays a total score that reflects your web app performance. It’s called Application Health Score (AHS).
The Application Health Score (AHS) is an Apdex-like numerical measure that can be used to estimate the quality of experience for your web application.
AHS is a product of 3 derivative service level indicators (SLI) — percentage of successful requests, percentage of “timely” requests, and agent availability. The “timely” requests are those with the total observed average request time P95 either below the low threshold (100% satisfying) or between the low and high threshold (partially satisfying).
A simplified formula for AHS is the following:
AHS = (Successful Requests %) * (Timely Requests %) * (Agent Availability %)
Each individual SLI in this formula can be turned on or off. By default, only the percentage of successful requests is on.
There are T1 and T2 thresholds for the total observed average request time P95, that you can configure for AHS:
- T1 is the low threshold for satisfying requests
- T2 is the high threshold for partially satisfying requests
If the average request time (P95) for the selected period is below T1, this is considered 100% satisfying state of requests. If the request time is above T1 and below T2, a “satisfaction ratio” is calculated accordingly. Requests above T2 are considered totally unsatisfying. E.g., with T1=0.2s and T2=1s, a request time greater than 1s would be considered unsatisfying, and the resulting score would be 0%.
The algorithm for calculating the AHS is:
successful_req_pct = (nginx.http.request.count - nginx.http.status.5xx) / nginx.http.request.count

if (nginx.http.request.time.pctl95 < T1)
   timely_req_pct = 1
else
   if (nginx.http.request.time.pctl95 < T2)
       timely_req_pct = 1 - (nginx.http.request.time.pctl95 - T1) / (T2 - T1)
   else
       timely_req_pct = 0

m1 = successful_req_pct
m2 = timely_req_pct
m3 = agent_up_pct

app_health_score = m1 * m2 * m3